Editor’s note: This is the first in a six-part series on the Durham Public Schools that originally appeared at the Bull City Rising Blog. The articles are reprinted here with authors’ permission.
Durham’s public schools often feature in the headlines and the editorials of our local papers. There’s a range of tropes that we hear frequently, and often without debate:
- Charter schools, we are told, are draining funds from Durham Public Schools’ educational resources and impacting the quality of DPS’ education, while not having to offer the same services that public schools do;
- An unfair conservative state regime seeking to destroy public education through encouraging charters and by a death-of-a-thousand budget cuts at the state level;
- A perceived tension between the school board and Durham County on schools funding, with seeming annual debates and disagreements between the boards, culminating in some years with marches on the County Commission to fight for funding;
- Scrutiny over discipline and suspension rates, with the district recently pledging to curtail out of school suspensions;
- The demographics of DPS, sometimes used as an explainer in some folks eyes, an excuse in others;
- The local and national focus on standardized testing, under attack and likely to see some reform in the post-NCLB era, yet still seen as crowding out classroom time and impacting learners.
Reasonable people may agree with some or even all of these tenets — or disagree with them. Still, it hasn’t escaped my notice that all too often, we seem to spend more time in these meta-conversations around our schools than in asking perhaps a more important series of questions:
Setting aside the politics of debate, are our schools performing as well as we can expect? Are we getting a reasonable level of assurance that DPS is spending money in ways that improve learning outcomes? Even given the number of students in charter schools and the high poverty rate of the district, how well does DPS do in comparison with districts that are relatively like it in size?
The answer, we find, is a mixed bag at best.
In this, the first of a multi-part series, we want to dive into the data behind the district.
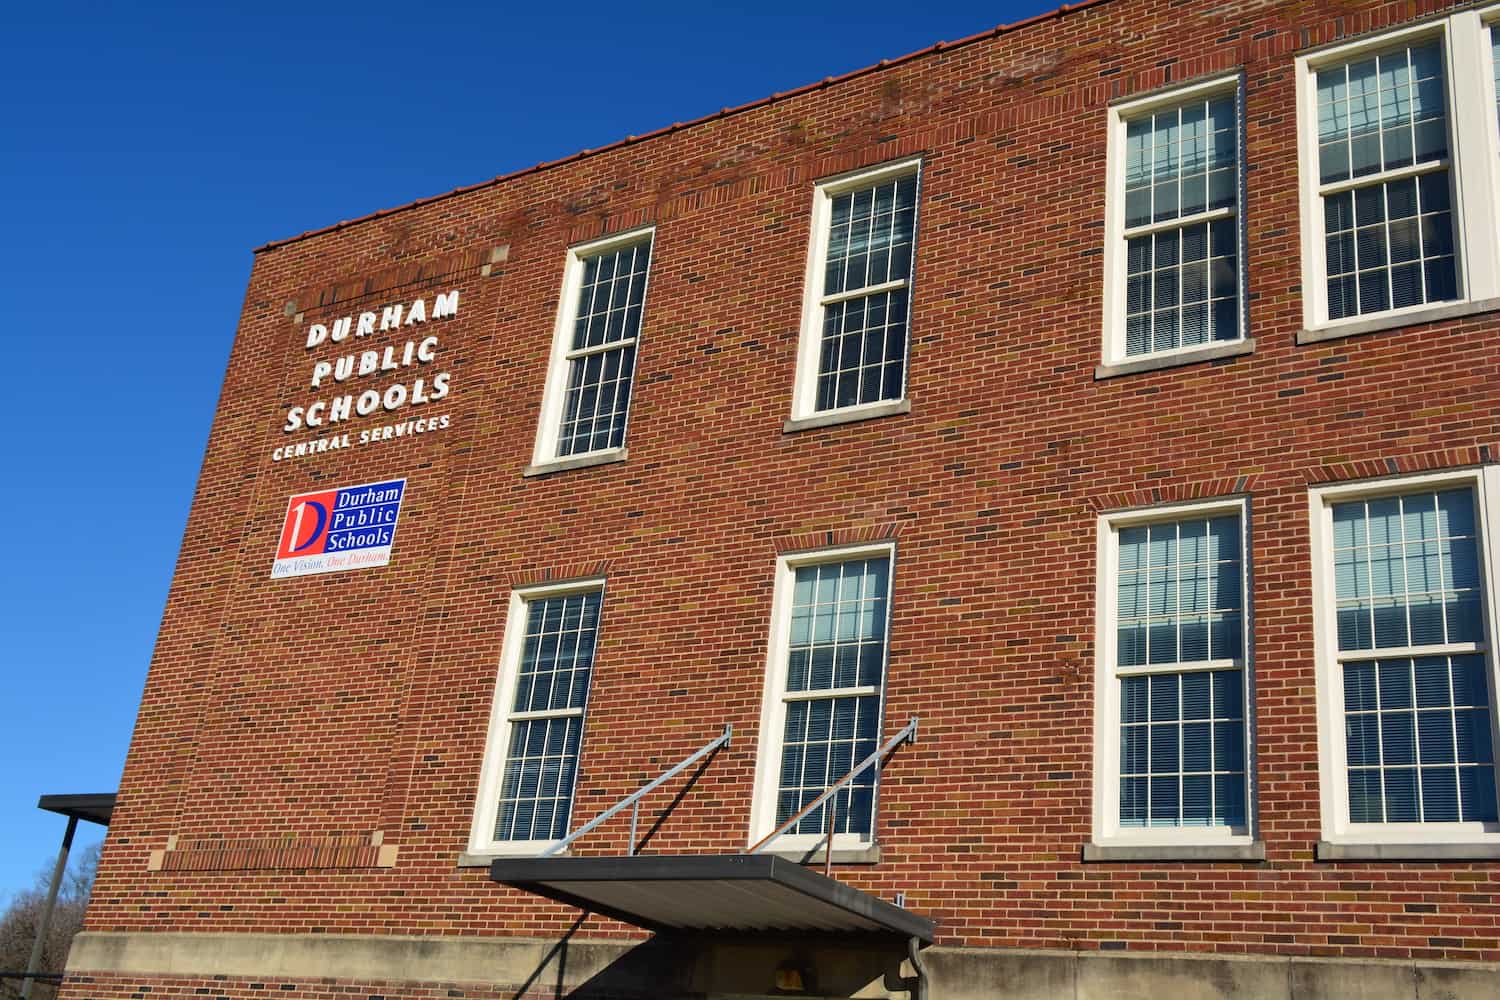
Our analysis was inspired by the work of Alex Modestou, a Duke grad, former DPS teacher, and currently perhaps the person paying more attention to the data on schools than anyone outside DPS’ Fuller Building HQ.
Since early December, I’ve been working with Alex to review some of the data he’s collected from DPS and the NC Department of Public Instruction (DPI). (You may have seen Alex’s name in the papers recently, either for raising questions about the inclusion of high-wage classified employees in raises marketed as for low-wage workers, and about DPS budget priorities.)
Out of this collaboration comes a series of four articles, beginning today. In these, we seek to address a few of the questions posed above.
I’d be remiss if I didn’t acknowledge upfront that this article came after Alex’s outreach, and makes new use of data he’s collected. Yet in the twenty-plus hours of work on this series, I’ve tried to subject the data (and suggestions) to the same scrutiny that I would with any other story.
This isn’t to say we’ve got everything perfectly-understood out of the chute in this series. Instead, I hope this series evinces in you, our readership, the same what-the-heck-is-this curiosity I’ve found as I’ve sought to make sense of a budget that is far more robust than DPS’s peers — and performance that is significantly more anemic.
This week’s series is, I hope, the beginning of a community conversation on how we make our schools better.
DPS superintendent Bert L’Homme acknowledged last week that DPS during this budget cycle would closely track district spending against a number of peer systems identified by staff. In doing so, L’Homme has set a bar for the 2017 budget process as one that will scrutinize all of the district’s expenses and seek to explain variances — of which, from our look at the data, there are many.
L’Homme’s pledge about the 2017 budget cycle is welcome; indeed, my hope is that out of that process, the discrepancies we note will either be closed, or explained.
And, as we enter the BOCC and school board elections, the questions raised in this series will be the top ones that Lisa Sorg and I ask of all candidates for both boards.
Durham supports its schools richly; we deserve a rich scholastic environment for our community’s children. We’re not there, and we need to be. This series is about asking how we can help our schools get there.
Later today, we’ll start with a review of how DPS stacks up against other districts using imperfect, but interesting, standardized test results. (We, too, have problems with the testing-heavy world our schools find themselves in; yet, there is value in at least seeing how different districts in North Carolina do when their students all take the same test.)
Tomorrow, we’ll look at how DPS’ financial resources stack up against other North Carolina districts in general, and against three similarly-sized districts in particular — Cabarrus, Gaston and Johnston.
On Thursday, we’ll dive deeper into a comparative analysis of where DPS does (and doesn’t) spend money on a per-pupil basis — a story that includes the impact of charters, but needs to go well beyond it.
Friday, we’ll look more closely at how and where DPS assigns teachers, and at disparities in areas like principals/assistant principals and teachers. And, we’ll wrap up the series with some closing thoughts.
Glossary of terms: We’ll use a number of terms throughout this series. Here’s a quick spoonful of the alphabet soup to follow. Unlike DPS students, you won’t face a test at the end of this.
- CCR – College and career ready
- DPI – Department of Public Instruction
- DPS – Durham Public Schools
- EC – Exceptional children, also referred to as students with disabilities
- EOC – end of course
- EOG – end of grade
- F&RL – Free and reduced lunch
- GLP – Grade level proficient
- MSA – Metropolitan statistical area


