The old adage that a picture is worth a thousand words is not always true, especially when it lacks context. Still, sometimes a map, a video, a chart, a sketch, or a photo can reinforce lessons you thought you had already learned.
With that in mind, let me call your attention to images published in recent days in the blog of Carolina Demography at UNC-Chapel Hill and in “The Lead Feed” of the state Department of Commerce. Together, they offer educators and policymakers perspective in grappling with the modern mega-state of North Carolina.
The state map with splashes of color ranging from deep blue to dark brown shows population gains and loses by sub-county Census tracts. The stunning map depicts a state in which overall robust population growth has been far from evenly distributed.
From 2010 to 2020, the state’s population grew nearly 10%, with North Carolina now ninth among the states. As Carolina Demography has pointed out, population grew in 49 of the 100 counties.
Since the 2020 census, the Raleigh and Charlotte metropolitan areas have ranked among the top 10 fastest-growing large metros in the nation. With people seeking jobs and quality of life, much of their growth has been fueled by in-migration from other states and immigration from abroad.
Of course, people also move from one place to another within the state. The map makes vivid a comment made to me recently by a public official in a distressed down-East community: “Our greatest export is our children.”
The map shows different levels of growth and loss among urban, suburban, exurban, and rural places. It depicts a state more complex than the customary construct of a rural-urban divide.
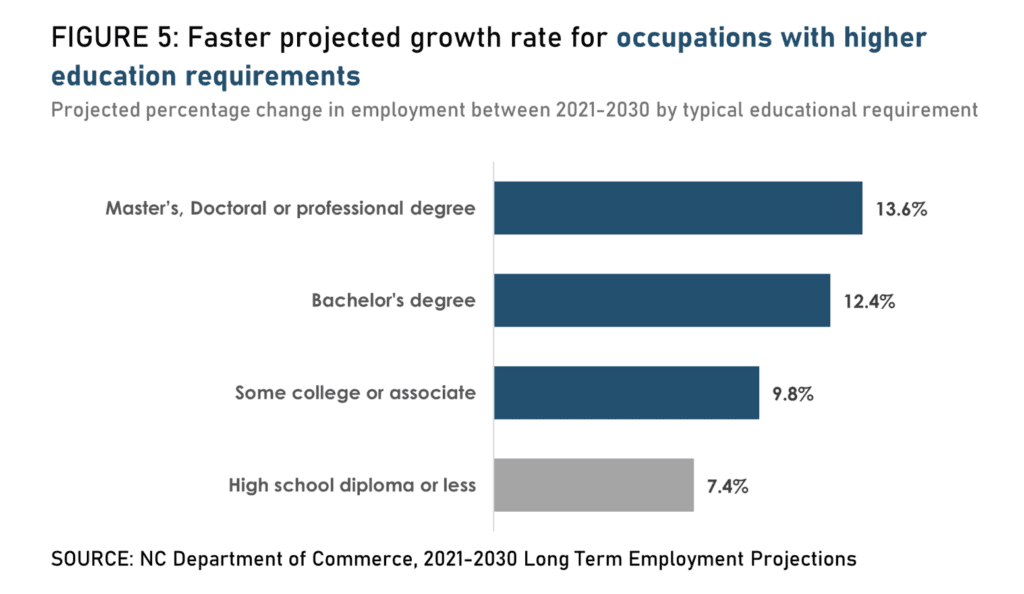
While the demography map gives one picture of North Carolina complexity, the Lead Feed graphic below explores complexity of another dimension by projecting this decade’s growth in jobs by educational requirements. The analysis suggests a paradox: the projections expect “jobs requiring more education to grow at the fastest rates, but … more than half of 2030’s jobs will typically not require more than a high school diploma.”

In the period from 2021 to 2030, according to the commerce department projections, occupations requiring master’s, doctoral, or professional degrees are likely to grow by 13.6% — a higher rate than occupations requiring a bachelor’s degree (12.4%), an associate degree or credential (9.8%), or a high school diploma or less (7.4%).
And yet, the shift toward high-education occupations only slightly diminishes the reality of pervasive low-wage, low-skill jobs across North Carolina. In 2021, say the analysts, occupations requiring no formal education or only a high school diploma accounted for 60.6% of total employment, with a modest decline projected to 59.7% by 2030.
As the U.S. Bureau of Labor Statistics shows, “Education pays.” Americans with a bachelor’s degree or above earn more and avoid unemployment more than the national averages.
The map and data charts help frame North Carolina’s challenges both in sustaining success and in lifting up people and places left behind. The state needs its potent metropolitan economic engines, even as it should bolster public schooling and child care to give rural and low-income young people a stronger chance to thrive, wherever they decide to live.
North Carolina officialdom has arrived at a message consensus — that “going to college" may not mean pursing a four-year university degree but rather an associate degree, a job-ready credential, or an apprenticeship. As important as that message may be, the evidence continues to argue for preparing and encouraging all young people with the potential and desire to seek the university degrees that lead to high-quality, expanding occupations.
In the budget-making for the 2023-25 biennium, the tally of wins and losses between the Democratic governor and the Republican legislative majority matters less than the scale of state government’s response to the complex demographic and economic realities of North Carolina.


