In the lead-up to this year’s election, demographics — gender, race, and ethnicity — have been a big part of the conversation; these factors often impact opinions about issues and, ultimately, the way that people vote. It sometimes feels like you can’t turn on the news today without hearing a story connected to race and/or gender. That got us thinking a lot about the role of race and gender in schools in North Carolina, so for our 17th and final month of Consider It Mapped, we decided to investigate school-related gender and race data.
All districts statewide have a fair amount of student diversity, but what about teacher diversity? To examine this question, we analyzed teacher gender and race data from 2010 through 2016 for school districts and charter schools. Because we didn’t want to compare data from entire districts with data from individual charter schools, we aggregated charter school data to the regional level.1
To begin, we mapped teacher gender for elementary school teachers (grades K-5) and secondary teachers (grades 6-12). The maps show the proportion of female teachers in each district or, for charter schools, aggregated to the region level. The top map shows districts and the bottom map shows charters by region, and the colors show the proportion of female teachers, with shades of red representing lower proportions of female teachers and shades of blue representing higher proportions of female teachers. Filters to the side of the map allow the user to look at the proportion of teachers by year and by school level. Historically, teaching has been a female-dominated profession, and cycling through the most recent years for each school level reveals that this continues to be the case in North Carolina: The majority of teachers are female, especially at the elementary level, and there is little indication that that proportion has changed across years. At the secondary level, there are more male teachers, but for the most part, teaching continues to be a female-oriented profession.
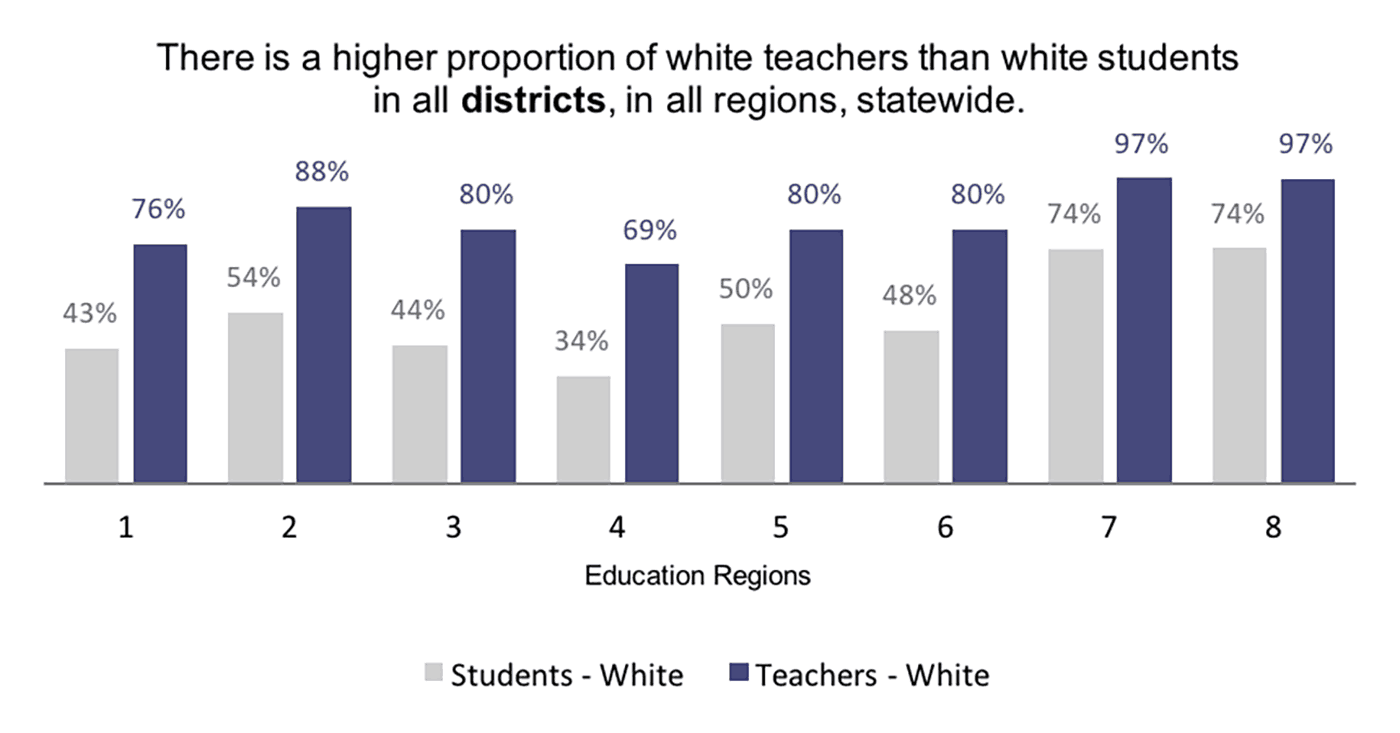
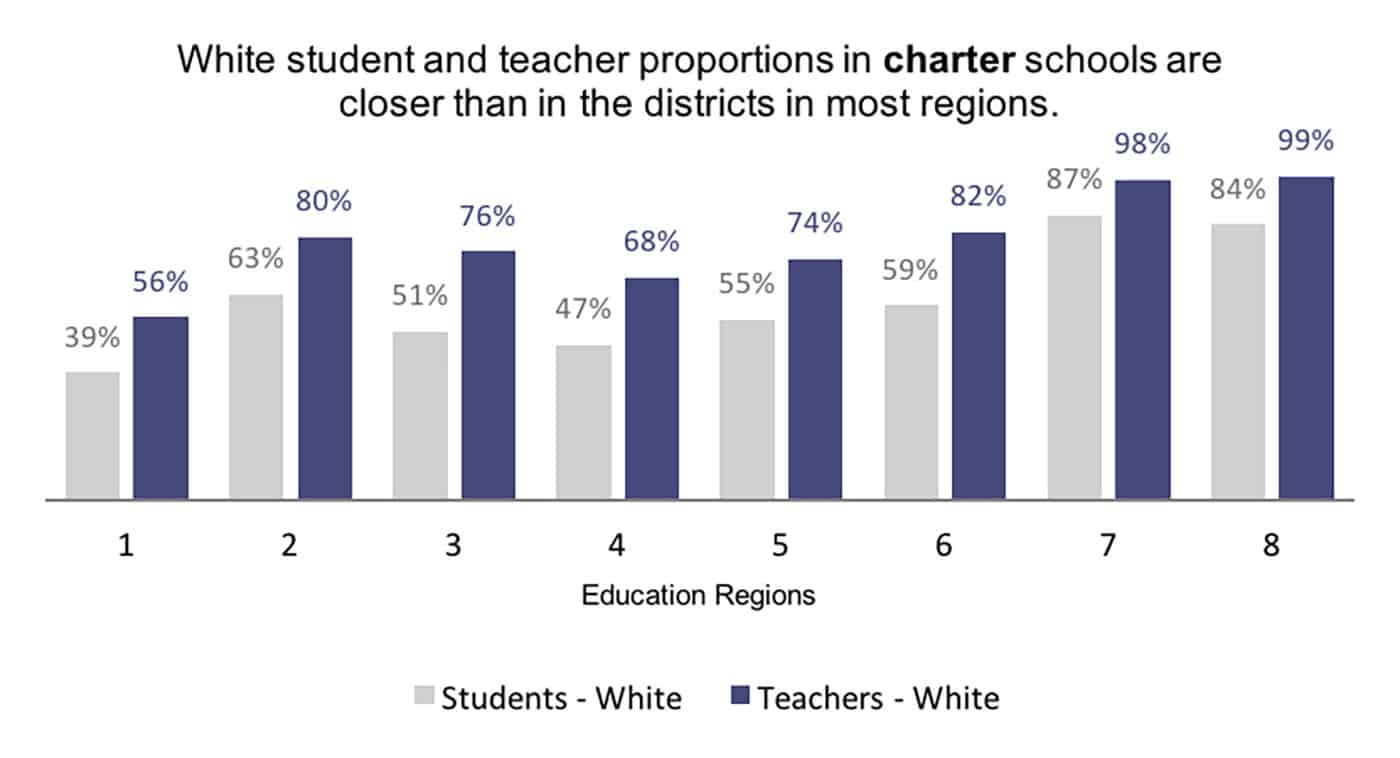
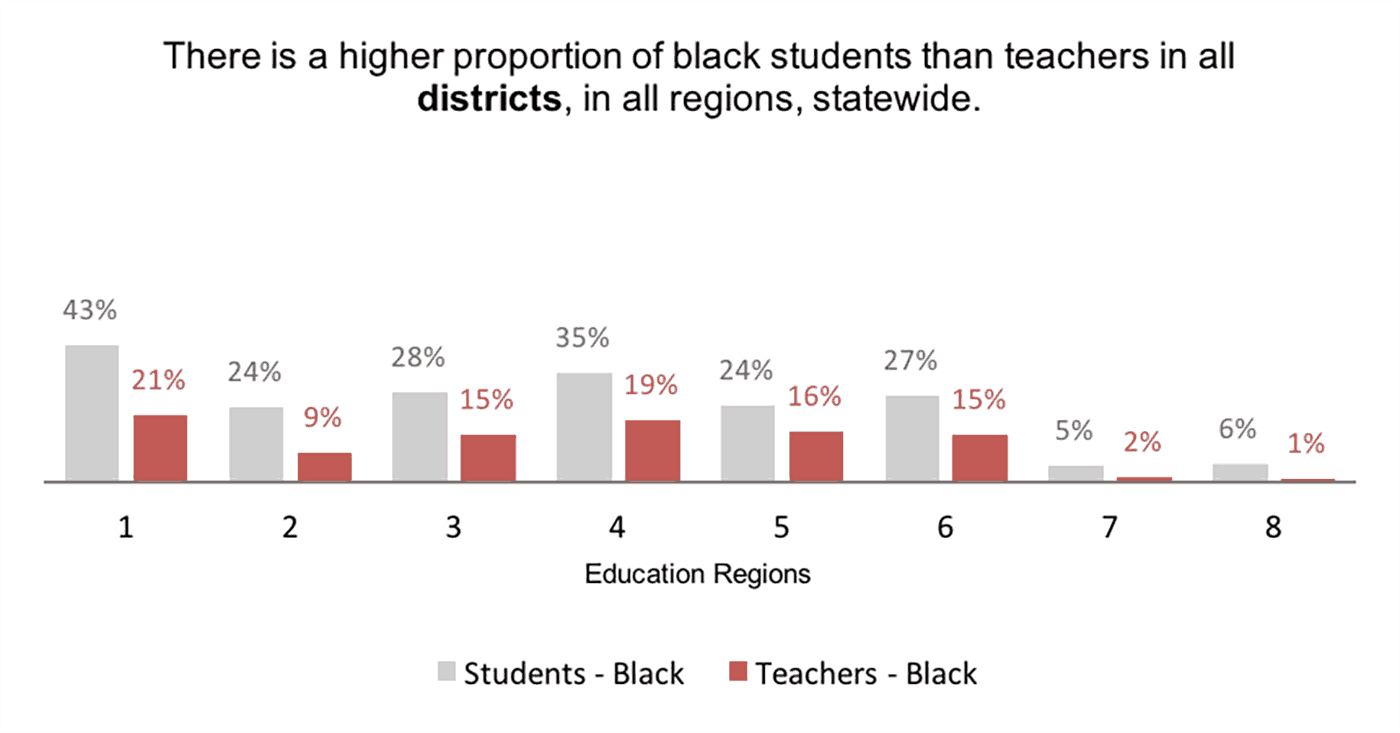
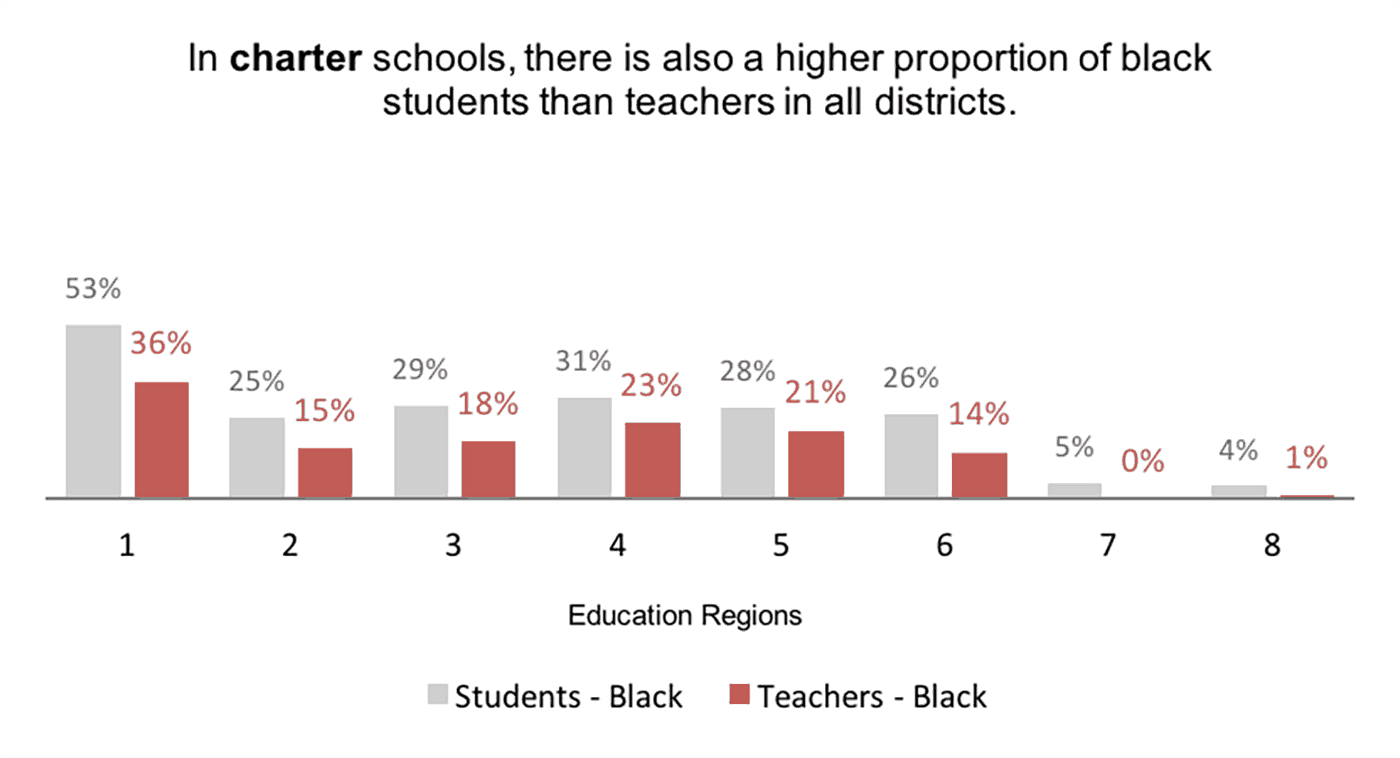
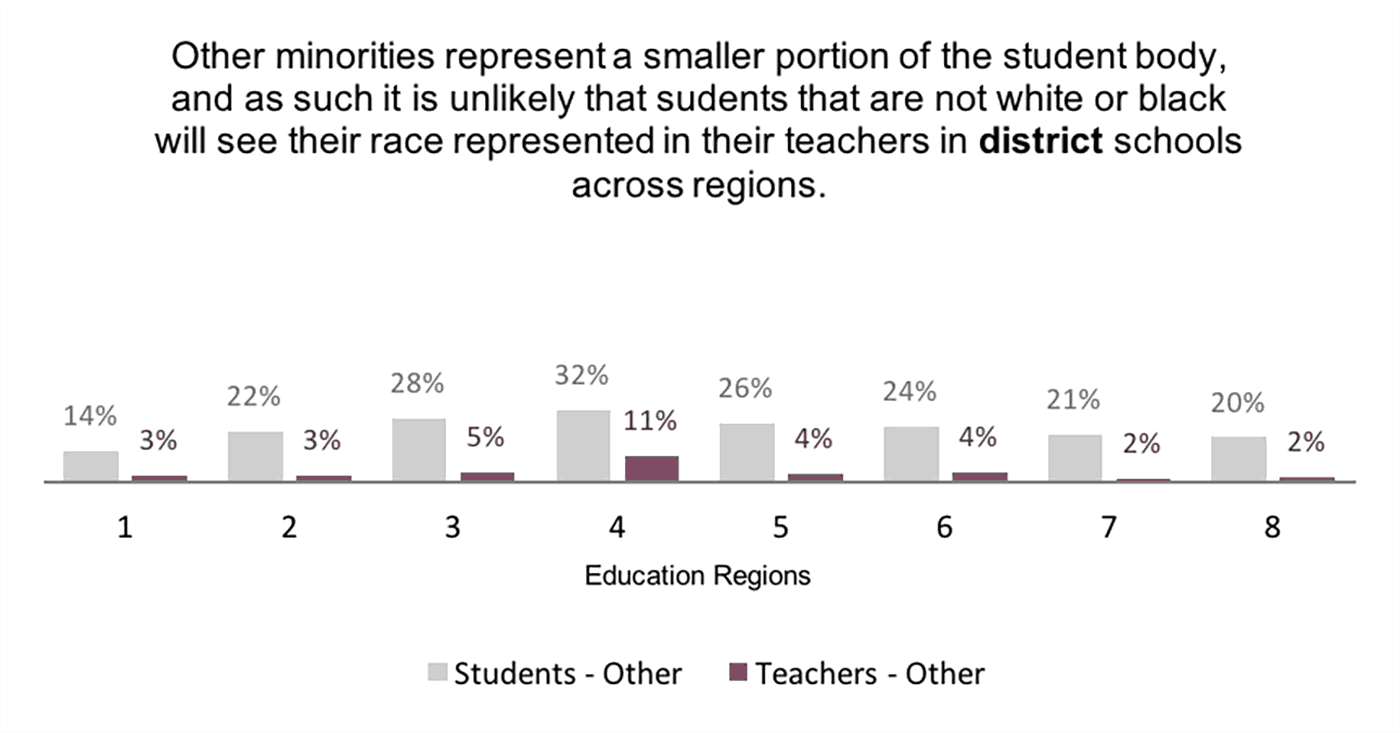
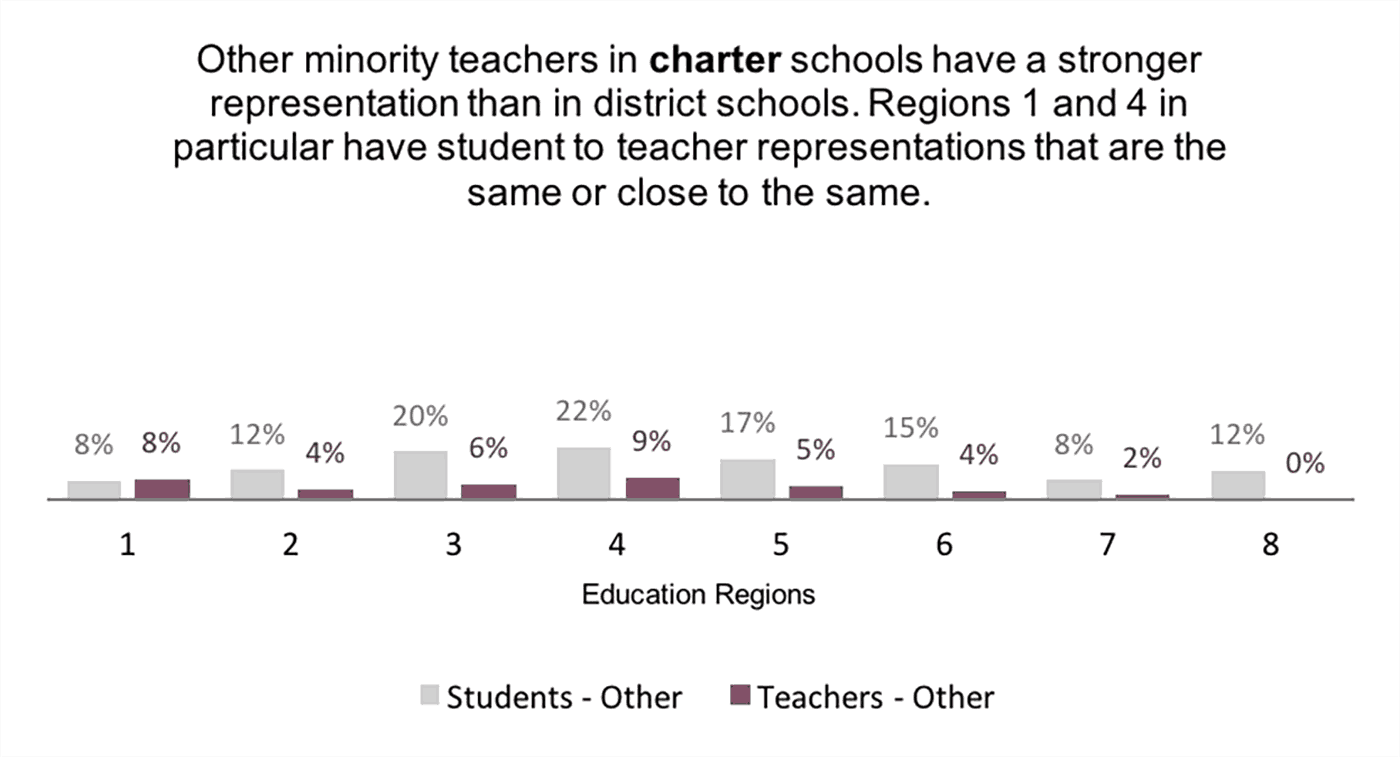
Next, we looked at teacher race. As has been noted before in other Education NC articles, the face of North Carolina’s student population is rapidly changing in terms of race, but has the state’s teacher corps become more racially diverse over the same set of years? We use bar graphs below to examine student race versus teacher race, contrasting the percentage of all students within a certain race category with the percentage of all teachers within the same race category, by region, for the 2015-16 school year. The data suggest that, across all eight regions in traditional and charter settings, there are differences — sometimes large — in the racial balance between teachers and the students they teach.
While white teachers appear to be overrepresented relative to the students they teach, black teachers appear to be underrepresented.
Underrepresentation also appears to be the case for teachers of other races, relative to their students.2
While this is only a cursory look at race and gender in schools, from our quick investigation, it does appear that most teachers are white females, which does not reflect the student body of North Carolina as a whole. I think we can all agree that diversity is important in our schools and communities, but a key conversation these data may help us have is how important we think racial or gender representation is for the teaching profession, and how important representation is relative to other teacher characteristics. Having adult role models that look like our students is arguably important, but is it important enough to require action, and, if so, how should we encourage more males and minorities to enter the teaching profession? Questions like these may be important to keep in mind as our education leaders and politicians continue to debate changes to our state’s approaches to teacher preparation, compensation, and career pathways.
What are your thoughts on the importance of teacher diversity in North Carolina? As always, let us know in the comments section below.
It is our hope that Consider It Mapped has encouraged you to explore the education data that our state has to offer — whether through just dipping a toe or taking a deep dive. In an age in which data tracking for reporting purposes and data transparency are becoming commonplace and expected across fields, data awareness is of the utmost importance — not only in terms of how to interpret data in a broader context, but also in terms of where to find the data you need to understand issues and tell your story. The majority of the data we have used for the Consider It Mapped monthly column is publicly available, and we would like to close out the series by sharing some of our most-valued resources.
The North Carolina Department of Public Instruction (NCDPI) is by far the MVP of school data in the state. NCDPI provides the public with data on school personnel, high school graduation, and student demographic data, including student population by school, free- or reduced-price lunch applications by district, and everyone’s favorite, school grades.
On the national level, the Elementary and Secondary Information System (ElSi), a product of the National Center for Education Statistics (NCES), allows users to create custom data sets by different geographic designations like county, district, and school. The available data includes enrollment data by grade, gender, and race, teacher:pupil ratio, and grades offered by school.
Finally, American FactFinder is an extension of the American Community Survey, which is part of the US Census. This is a great source of data at the county level in North Carolina, and includes everything from demographics to home prices to employment data and more.
Thanks for reading and sharing your thoughts with us over the months here on Consider It Mapped. If our column inspires you to take the reins and create your own visualizations in the future, please share them with us on social media and at EdNC.org; we’d love to stay connected!


