As we’ve been discussing on Consider It Mapped for the past couple of months, factors external to education, or secondary to a child’s time spent in school, can influence a child’s academic achievement. We’ve talked about housing and school safety, and this month we’re going to talk about the landscape for children even before they start their traditional K-12 education.
Decades of research has shown that early childhood education helps children develop social skills and prepares children to be successful in school. These outcomes are more likely to be achieved in high-quality programs—an important issue for parents seeking childcare assistance. To help ensure quality, North Carolina issues annual guidelines for and ratings of early childcare providers to help parents to make informed choices about their children’s care.
Before getting into details, I begin this month by describing the types of childcare providers and the rating system. There are two types of providers: 1) family childcare homes and 2) centers. Family childcare home providers serve five or fewer preschool-aged children in a residential setting, and centers serve three or more children outside of a residential setting. To operate an early childhood center or home as a business, providers must be licensed, and part of the licensing process includes assignment of a rating.1 Ratings are based on a five-star system. One star—the lowest rating—means that a provider at least has met baseline requirements for operation, including minimal staff education levels and program standards related to health, safety, space, and equipment. Providers who demonstrate that they meet additional criteria earn more stars; the higher the star rating, the more the provider has done to improve the quality of the program for the children in their care.2 The positive outcomes for young children associated with early care and education that I noted above typically are more likely to be seen for children who are receiving higher-quality care.
There are many reasons beyond ratings alone for why parents choose a provider, including convenience to their home and/or workplace, availability of providers in their area, facility hours of operation, and cost.3 For example, one parent might choose a family childcare setting because it is smaller and seems less chaotic. Another may choose a center setting because she believes that it helps children gain familiarity with a new environment outside of the home. Some parents have the luxury of time to consider different providers, but some are pressed for time and resources and are only able to consider a single provider. The latter are often lower-income parents who, according to some studies, place the same high value on provider quality, convenience, and affordability as their middle and high income counterparts, but who may have fewer choices available or less time to make those choices.4
This month’s visualizations look at the landscape of early childcare providers across North Carolina, including the proportion of different star-rated providers statewide and potential connections between star ratings and levels of poverty in different communities.
Prevalence: In North Carolina, there are over 4,600 licensed centers versus slightly over 2,100 licensed family childcare home providers.


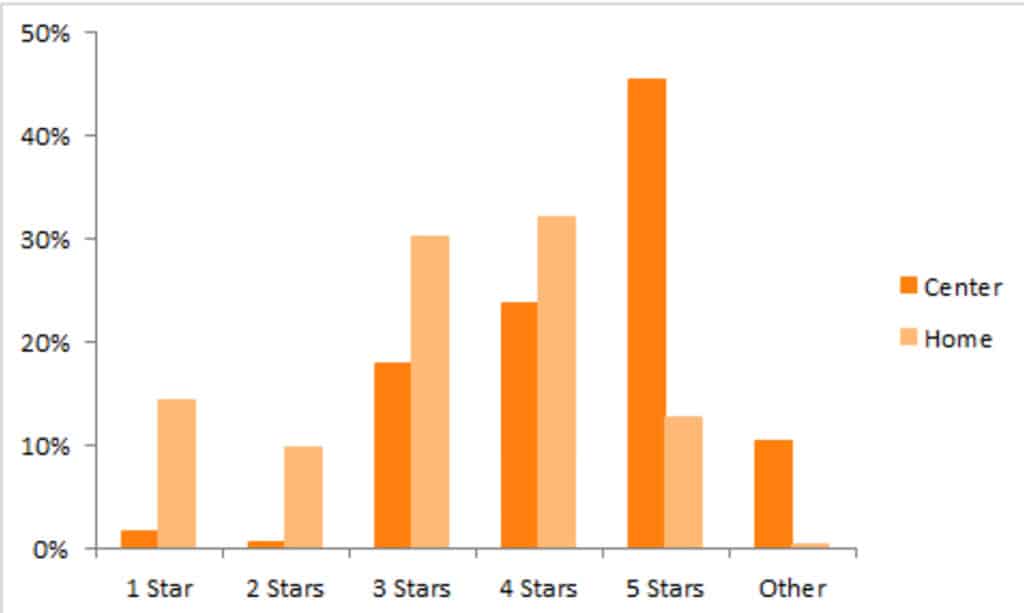
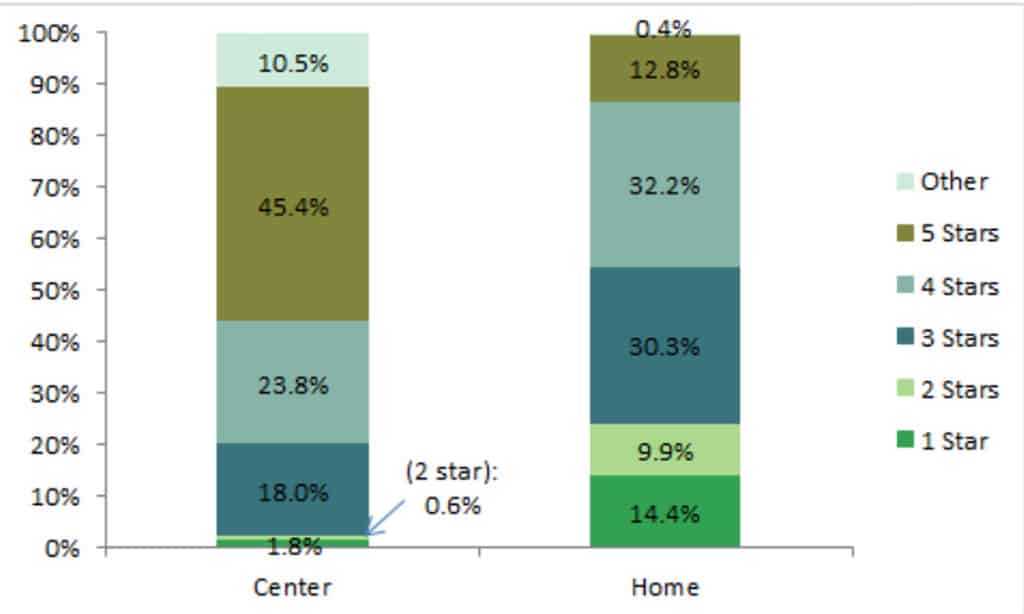
These graphs show that there are proportionally many more 5-star-rated centers5 than family childcare home providers6; the majority of family childcare home providers fall into the 3- to 4-star range. There are also proportionally many more 1- and 2-star-rated family childcare home providers than similarly-rated centers (24.3 percent of home providers are rated 1- or 2-star, versus only 2.4 percent of centers). These contrasts are even more apparent in the stacked bar graph. Collectively, the proportions in the charts above, the ratio of centers to family childcare home providers, and the larger enrollment sizes of centers show that that the majority of North Carolina children in early childhood education are in highly-rated licensed centers. In fact, currently about 95 percent of North Carolina children in childcare are in licensed centers.
Distribution: Our interactive map this month is geared toward looking at both the distribution of star ratings statewide, and the relationship between star ratings and community poverty levels. Leaders in the field of early childhood education provided me with the star ratings data, and together we hypothesized that areas of higher poverty in North Carolina would have concentrations of lower-rated providers. However, unlike the housing stability and school safety maps I shared with you over the past couple of months in Consider It Mapped, this does not seem to be the case. We can unpack the visualizations for this month to see why.
We can begin with the map that shows the proportion of 5-star-rated providers in each county. At a high level, the map bears no resemblance to maps I created last year of school district rates of students enrolled in the Free and Reduced-Price Lunch program (for more on using this measure as a proxy for poverty, see our feature on FRL from last November). Selecting a county in the map allows a user to see the number of each provider type in that county in the chart below. Looking at the breakdown of early childhood education providers in each county demonstrates that, in many counties, there are a high number of highly-rated providers.
Finally, the bar-and-circle charts pair data on star-rated providers with poverty rates at the Census tract level (a rough estimation of neighborhood).7 If lower-rated providers were located in higher-poverty areas, the bars or circles for the 1- and 2-star-rated providers would be clustered toward the top of each of the charts. Instead, as you can see in the graphs, 3-, 4-, and 5-star-rated providers appear to be distributed relatively evenly across areas of high and low poverty—contrary to our initial hypothesis—challenging our notions of possible connections between provider quality and community wealth.
It is important to note that these are purely geographic observations, with much more emphasis on availability of providers than on actual access: Just because there are five providers available in an area does not mean that every parent will be able to access all of the providers; the choices that they make for their children must be balanced between the highest-quality care available to them and what they can afford. We need to conduct more research to determine whether actual provider options are related to socioeconomic status (e.g., that less-wealthy parents are only able to afford lower-quality care)
For many, early childhood education provides the building blocks for many years of education. This month’s visualizations provide some insights into the quality of that early education, but they also leave us with many more questions. In addition, they do not shed light on an important segment of the population: students who do not receive any type of early childhood education at all.
As always, I’d love to hear from experts who can provide more context for these visualizations or more information about the topic as a whole, so if you have thoughts or ideas, please reach out to us and share in the comments section.


