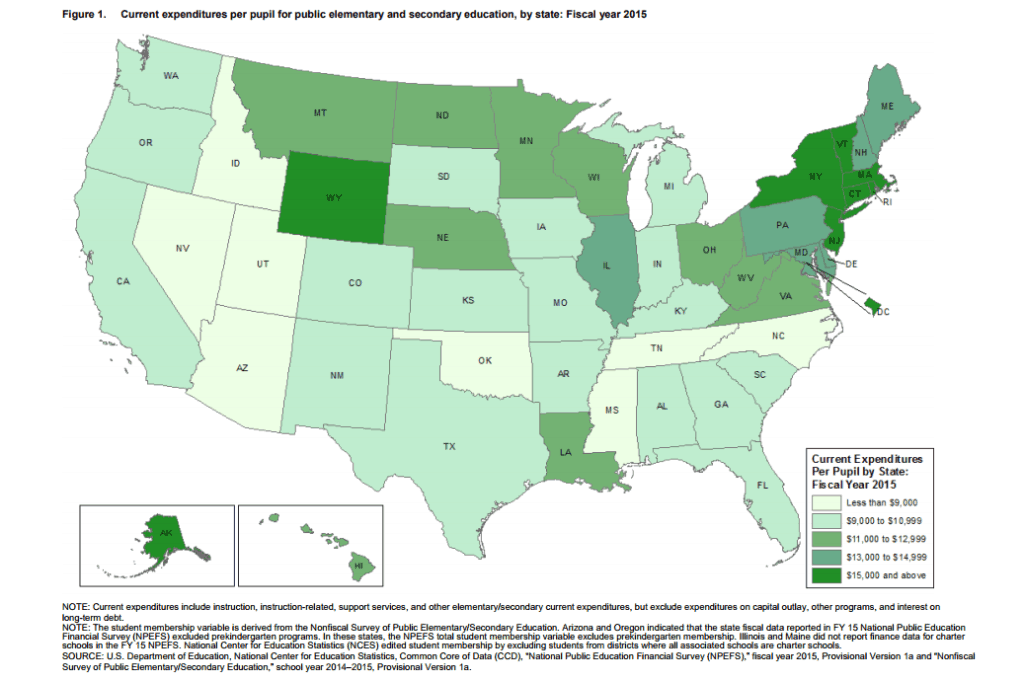
In a new report from the National Center for Education Statistics filled with data tables, it is the color-coded map of the 50 states that catches the eye. North Carolina shows up among the eight states colored in the palest shade of green.
The map depicts the states in terms of their per pupil spending for public elementary and secondary education. In the bottom eight, North Carolina is accompanied by Tennessee, Mississippi and Oklahoma, as well as four states in the mountain West.

The NCES report is a basic straight-ahead document of government statistics, decidedly not a political manifesto. Still, the report provides an element of context at the outset of what is shaping up as a consequential policy and political cycle in North Carolina – a budget-review session of the General Assembly, followed by the 2018 legislative elections, then the long legislative session of 2019, followed by the governor’s race and statewide elections of 2020.
It has been 10 years since the state got hit hard by the Great Recession. It has been eight years since Republicans won control of both the state House and Senate and six years since they gained veto-proof majorities. For much of this decade, state education policy has largely been driven by Republican initiatives, and shaped as well by intramural Republican debates.
The days of all-politics-are-local have ended. The party of the president tends to lose ground in the subsequent mid-term elections. North Carolina Republicans, led by an aggressive campaign organized by now-U.S. Senator Thom Tillis and state Senate leader Phil Berger, seized their advantage in the second year of Democrat Barack Obama’s presidency. This year’s election comes in the second year of Republican Donald Trump’s presidency. Thus, the 2018 elections in North Carolina are likely to be shaped in large part by his break-the-norm style and on voters’ judgment of Republican legislative rule.
A current flashpoint – the friction over the legislature-mandated class-size reduction in kindergarten through third grade – signifies the larger debate over North Carolina’s education and fiscal priorities. School administrators say legislators did not fully fund the additional teachers and classrooms needed to meet the small-class targets, and they would have to cut back on art, music and physical education instructors.
Republican lawmakers argue, repeatedly, that they have appropriated sufficient funds for teacher pay raises and for class-size reduction. Still, the question arises: Why does North Carolina have to make a choice between smaller classes and cultural enrichment?
In a story featuring the NCES data and map, the national education news website The 74 Million pointed out that six of the highest-spending states were among the 10 highest-rated states for overall school quality in Education Week’s most recent Quality Counts report cards. Among the states, education spending and school quality do not align precisely. And yet the data reinforce the question of why North Carolina can’t find enough money to move forward more robustly on teacher pay, principal pay, class size and STEM.
While North Carolina shows up in the bottom eight states in the NCES map, the most recent Education Week Quality Counts report gives North Carolina a C-minus overall grade, placing the state 39th among the 50.
Between 2008 and 2015, according to an analysis by the Center on Budget and Policy Priorities, per pupil spending, adjusted for inflation, declined by 12.2 percent in North Carolina. Both the NCES and the CBPP reports use data from 2015, the most recent available for state-by-state comparison. As legislators will point out, they increased appropriations since then. Still, an analysis by the National Education Association indicated that North Carolina’s per pupil expenditures actually declined from 2016 to 2017. After 10 years, the state has not returned to pre-recession investment in its schools.
North Carolina now ranks 9th in population. The rest of the top-10 states provide more in per pupil spending. That’s the message from the eye-catching NCES map that helps frame the policy and political debates in 2018, 2019 and 2020.


