|
|
Community colleges saw unprecedented enrollment drops this past year as students dealt with the challenges brought on by the COVID-19 pandemic. As community college faculty or staff will tell you, their students often face bigger challenges in their pursuit of higher education than those at a four-year college or university — and that’s without a pandemic.
In the spring of 2020, EducationNC surveyed North Carolina community college students to see how COVID-19 had impacted them. This spring, we sent a similar survey to all 58 community colleges to see how students are doing one year later.
Many of the 5,000-plus community college students who responded to our survey reported they lost jobs, had trouble paying bills, struggled to pay for college, and were in a worse financial situation now compared to before the pandemic.
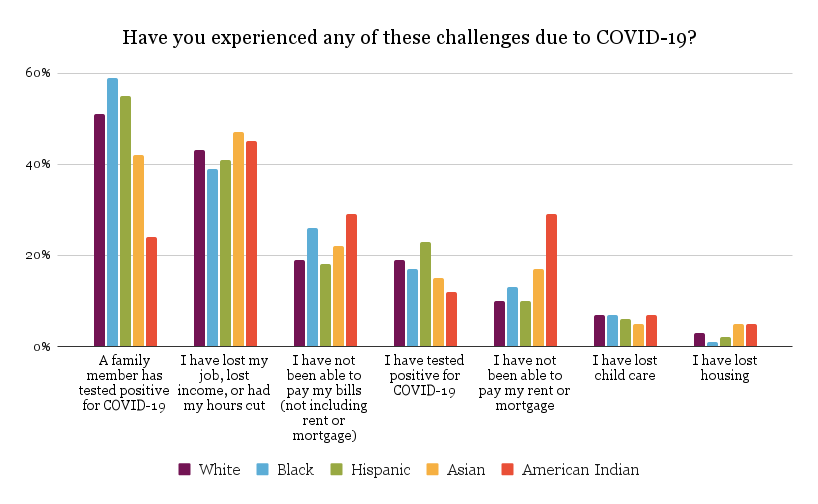
Half of respondents said they have a family member who tested positive for COVID-19, and 18% said they themselves contracted the virus.
Overall, students who were enrolled in continuing education or workforce development courses reported more challenges in pursuing their education as a result of the pandemic than those enrolled in curriculum courses.
Continuing education students more likely to change college plans as a result of the pandemic
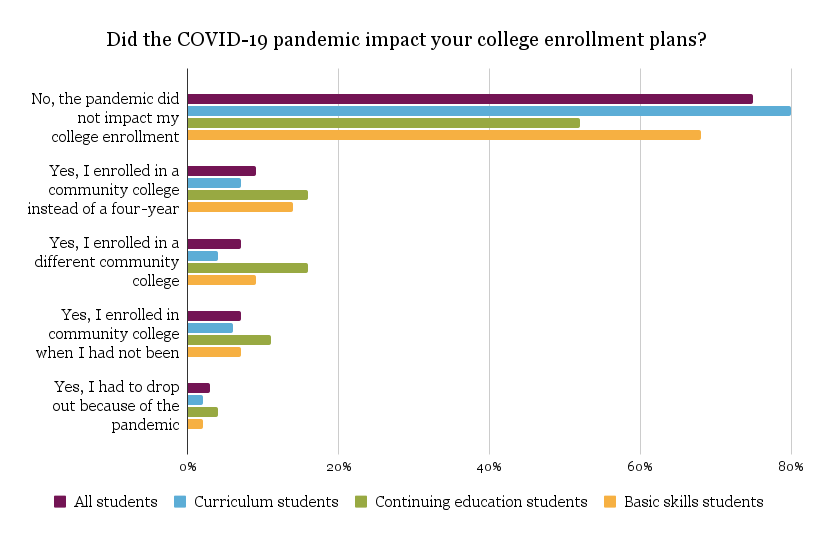
Three-quarters of survey respondents said that the pandemic did not impact their college enrollment plans. Of the other 25%, 9% said they enrolled in a community college instead of a four-year university, 7% said they enrolled in a different community college, 7% said they enrolled in community college when they had not been planning to previously, and 3% said they had to drop out because of the pandemic.
When broken down further, however, students enrolled in continuing education courses, students ages 25-44, and male students were all more likely to say the pandemic impacted their enrollment plans than both curriculum and basic skills students.
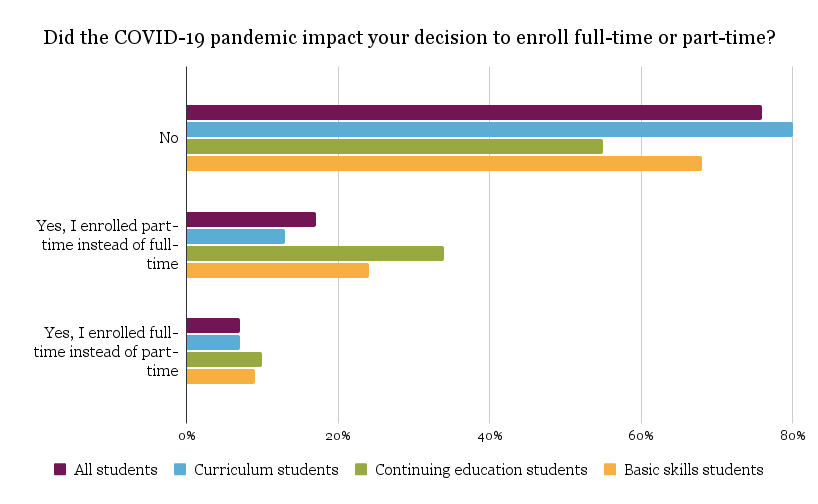
The majority of students (76%) said the pandemic did not impact their decision to enroll full-time or part-time. However, 17% said the pandemic caused them to enroll part-time instead of full-time, and 7% said they enrolled full-time instead of part-time. Again, continuing education students were more likely to report changing their plans: 34% of continuing education students said they enrolled part-time instead of full-time due to the pandemic compared to 13% of curriculum students.
In addition to changing their college enrollment plans, continuing education students and male students were more likely to say they changed their program, major, or pathway of study as a result of the pandemic. While only 18% of curriculum students said they changed their program, major, or pathway of study because of the pandemic, 40% of continuing education said they did.
Continuing education students and those ages 25-44 more impacted financially by pandemic
We asked respondents how their household’s current financial status is compared to pre-pandemic. Overall, 45% said it is about the same as it was before the pandemic, 37% said it is worse than it was before the pandemic, 9% said it is better than it was before the pandemic, and 8% said they don’t know.
Results were largely consistent across student groups, but some differences emerge when you break it down by age. Respondents ages 25-44 were most likely to say their household’s current financial situation is worse now than it was before the pandemic (44%) compared to other age groups.
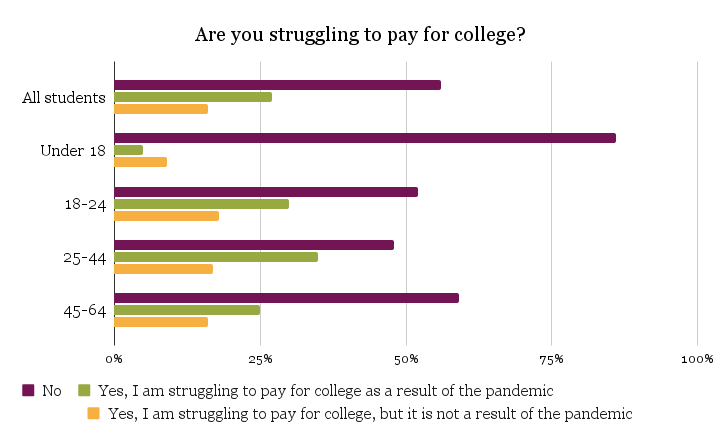
Both continuing education and basic skills students were more likely to say they were struggling to pay for college as a result of the pandemic (38% and 37%, respectively) compared to curriculum students (24%). Students ages 25-44 and male students were also more likely to report struggling to pay for college as a result of the pandemic.
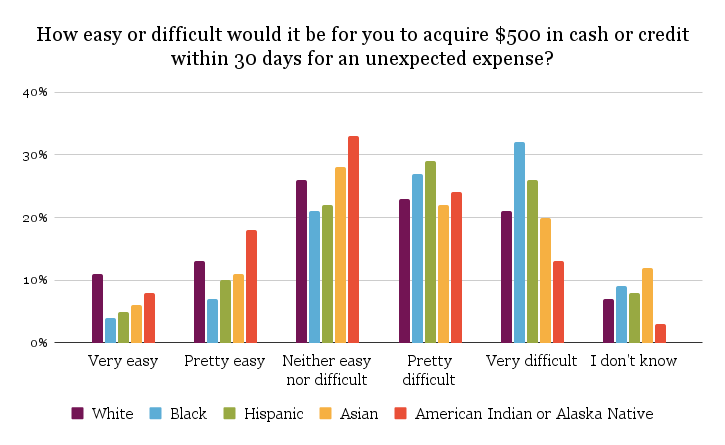
We also asked respondents how easy or difficult it would be to acquire $500 in cash or credit within 30 days for an unexpected expense. Overall, 47% of respondents said it would be pretty or very difficult, 25% said neither easy nor difficult, 21% said pretty or very easy, and 8% said I don’t know.
Breaking it down by race/ethnicity, Black and Hispanic students were more likely to say pretty or very difficult (59% and 55%, respectively) than white, Asian, or American Indian students (44%, 42%, and 37% respectively). Female students were also more likely to say pretty or very difficult (53%) than male students (34%).
Still some challenges with online learning
Only 2% of survey respondents said they did not have internet access at home (note that this is likely lower than in the overall community college student population since the survey was conducted online). However, 30% of respondents said their internet is not always reliable, including 37% of continuing education students, 35% of Hispanic students, and 44% of American Indian students.
The same percentage of students said they have a laptop on which to do their coursework in this year’s survey as last year’s survey (84%). However, only 74% of continuing education students said they have a laptop compared to 86% of curriculum students.
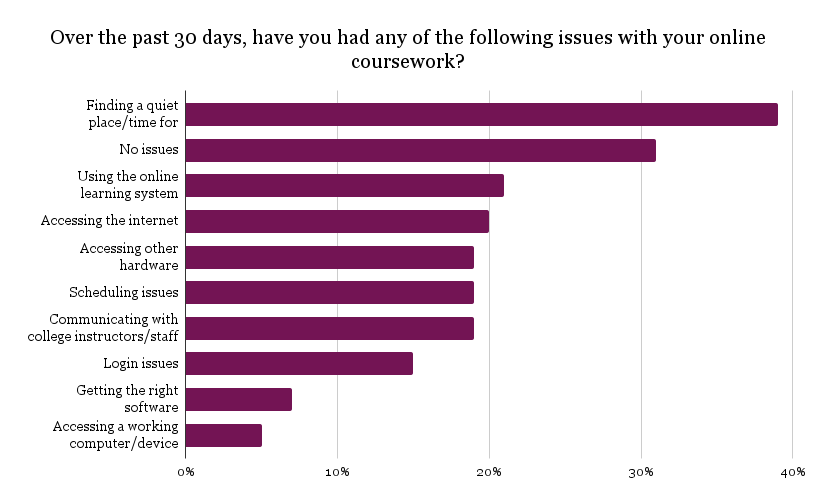
Finding a quiet place/time for schoolwork continues to be the biggest challenge for students with their online coursework, followed by using the online learning system and accessing the internet. About one-third of respondents (31%) said they’ve had no issues with online learning over the past 30 days.
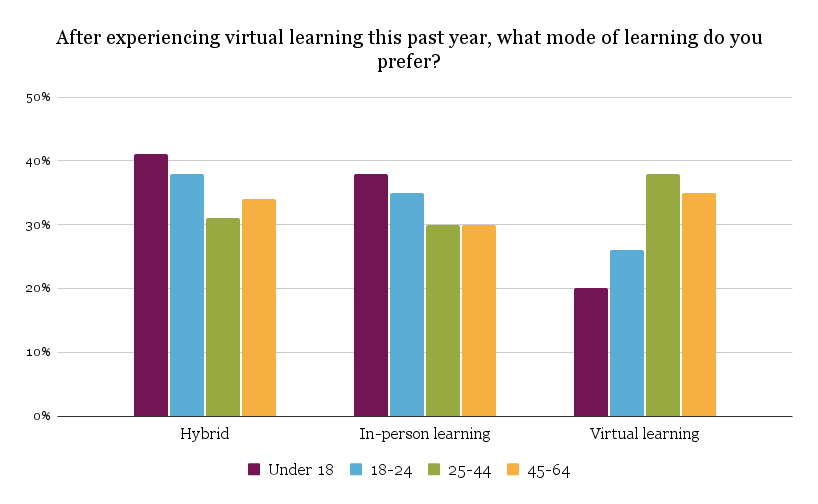
Overall, however, students are split in their preference for in-person learning, virtual learning, or a hybrid of the two. When we asked respondents which mode of learning they prefer, 36% said hybrid, 34% said in-person, and 30% said virtual.
Continuing education students were more likely to prefer in-person learning (40%) compared to hybrid (30%) or virtual (29%). Students ages 18-24 prefer hybrid or in-person learning over virtual learning whereas students ages 25-44 expressed a higher preference for virtual learning. Female students were somewhat more likely to prefer hybrid learning whereas male students were somewhat more likely to prefer in-person learning.
Challenges of COVID-19
Three in 10 respondents (30%) said they have had trouble completing homework and other assignments because they did not have adequate child care. That number was highest for students ages 25-44 — almost half (47%) said they had trouble completing assignments due to a lack of child care.
Half of respondents said they had a family member who tested positive for COVID-19, and 18% said they tested positive for COVID-19. Students under age 18 and Black students were most likely to say they had a family member test positive for COVID-19 (84% and 59%, respectively). Hispanic students were most likely to say they had tested positive for COVID-19 (23%).
Who participated in the survey?
Overall, 5,473 participants responded to the survey. Of those participants, 307 did not answer any questions beyond the initial demographic information, leaving the survey with 5,166 reported respondents (partial responses included). These results include only unverified, self-reported data.
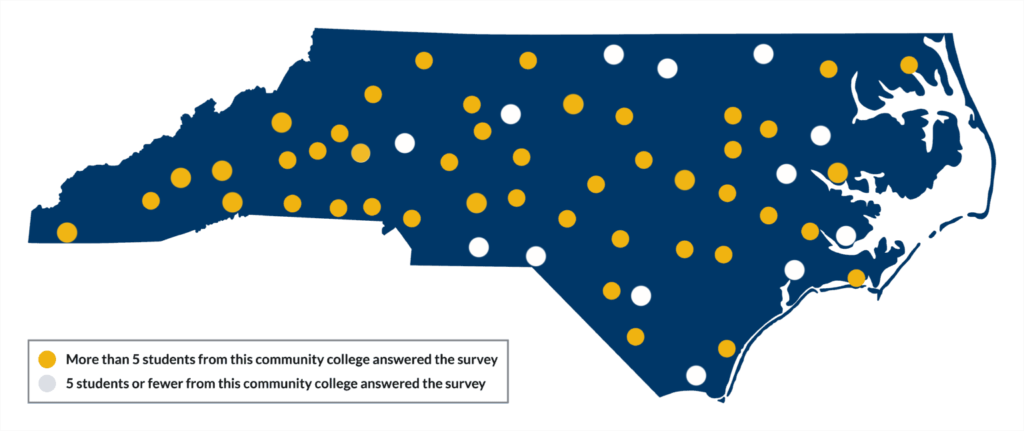
EdNC emailed the survey link to every community college president with the request to share the survey with students. More than five students at 45 of the 58 colleges participated in the survey (identified in yellow on the map below). Five colleges did not have any students participate in the survey: Bladen Community College, Brunswick Community College, Coastal Carolina Community College, Guilford Technical Community College, and Pamlico Community College. Another eight had fewer than five students participate.
Half of the survey participants said they are full-time students, 30% said part-time, and 18% said they are dually enrolled through Career and College Promise (including early college). Just over 70% are enrolled in curriculum courses, 18% in continuing education (workforce development), and 16% basic skills.
Of the 5,215 respondents who identified their race or ethnicity, 64% identified as white; 12% Black or African-American; 11% Hispanic, Latino, or Spanish; 4% Asian; 3% two or more races/ethnicities; 3% American Indian or Alaska Native, and 1% Native Hawaiian or other Pacific Islander. Three percent preferred not to answer.
Almost seven in 10 respondents (68%) identified their gender as female, 28% as male, and 1% as transgender. Another 1% said they do not identify as male, female, or transgender, and 1% preferred not to answer.
We also asked respondents their age. Sixteen percent are under 18, 44% are 18-24, 32% are 25-44, 8% are 45-64, and 1% are 65 or older. One percent preferred not to answer.
