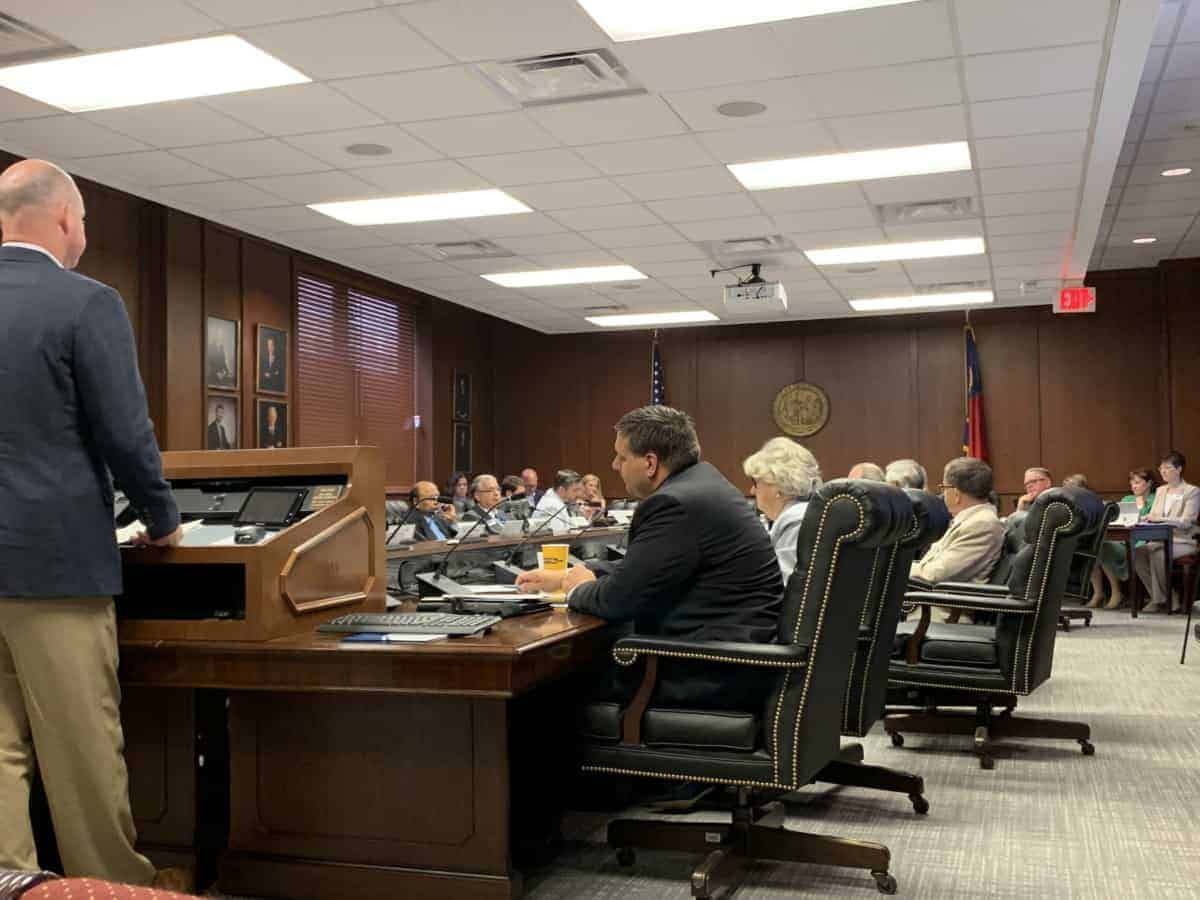
The community college system as a whole is trending upwards on most of the seven performance measures the system uses to judge the success of its schools. The State Board of Community Colleges heard a presentation on the data Thursday.
Before launching into the data, it’s important to understand the benchmarks used to understand them.
The system sets a system-wide baseline and excellence level for every measure it uses. It uses three years of data, if that many years is available, and sets the baseline level two standard deviations below the system’s average and the excellence level one standard deviation above the system average.
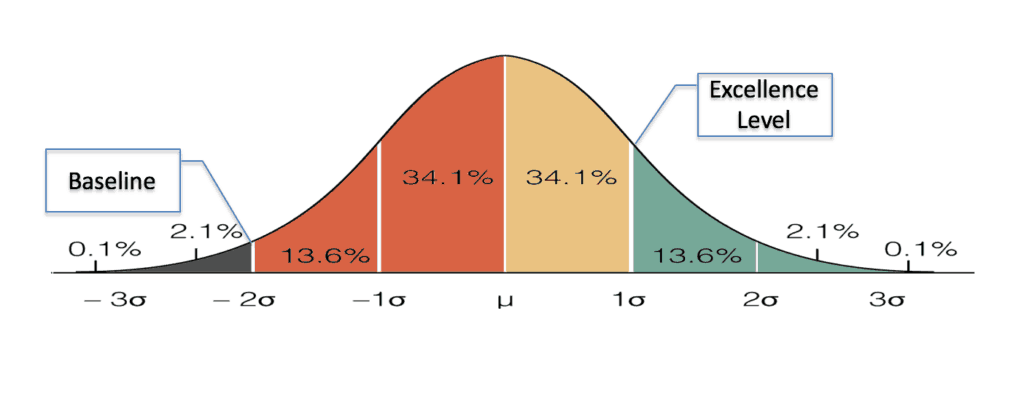
So, the four categories for colleges in each measure are: meet or exceeds excellence, below excellence but above average, below average but above baseline, or below baseline.
Basic skills progress
This measures whether students in adult education are gaining at least one measurable skill during a year. The skills are measured in areas such as adult high school credits, postsecondary enrollment, high school equivalency test passage, or adult high school program completions.
In this measure, the system total for all students was 39.9%. That is close to the average college percentage of 41.8% and well above the baseline of 24.2%. The excellence level in this measure is 50.6%.
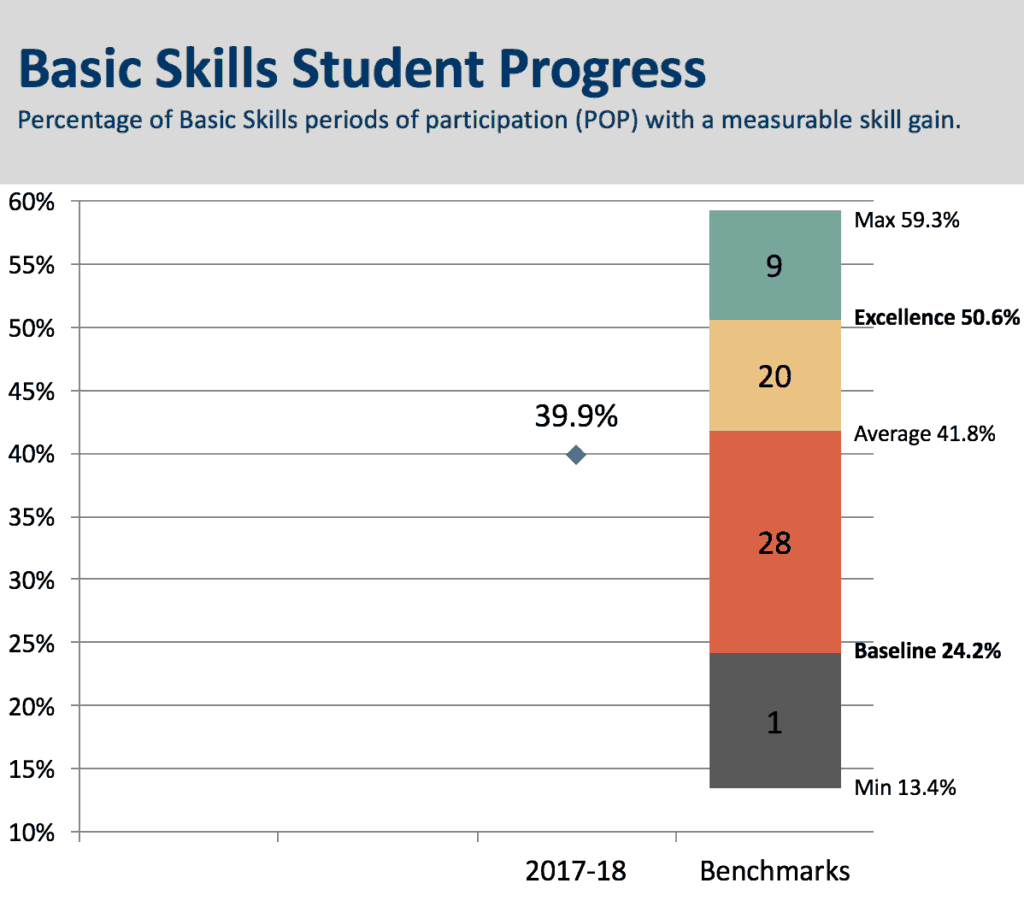
Nine schools met or exceeded excellence, 20 schools were below excellence but above average, and 28 schools were below average but above the baseline. Only one school, Roanoke-Chowan Community College, performed below the baseline in this category.
Student success rate in college-level English courses
This category looks at the percentage of first-time associate degree and transfer students who get a “C” or better in a credited English course in the first three years of their first fall term.
The system total for this measure was 61.7%, which is above the 61% average for community colleges. The baseline measurement for this category is 40.1% and excellence is rated at 66.6%.
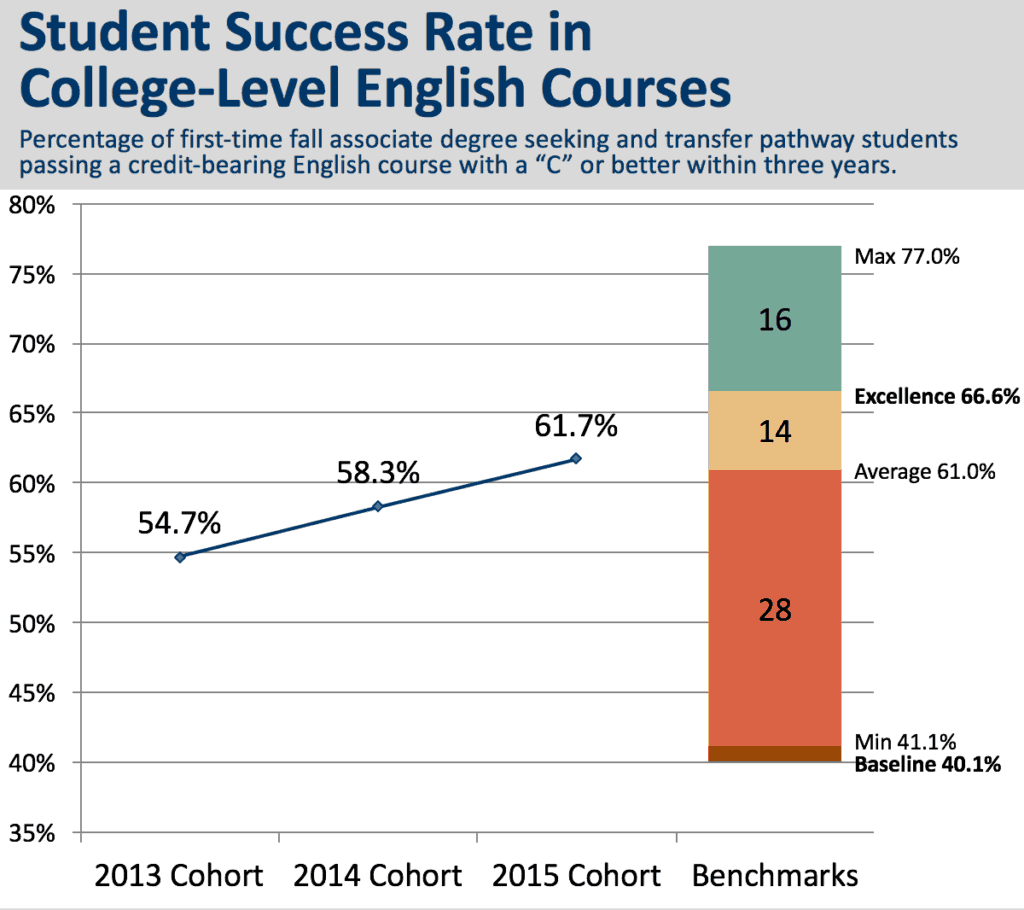
Sixteen schools met or exceeded excellence, 14 schools were below excellence but above average, and 28 schools were below average but above the baseline. No schools performed below baseline. The chart above illustrates how the system total has been steadily increasing annually from 54.7% in the 2013 cohort to 61.7% in the 2015 cohort.
Student success rate in college-level math courses
This is the same as the last category but applicable to math courses.
The system total is 41.5%, which is also the average community college percentage. It is well above the baseline of 19.5%. The excellence level is 46.2%.
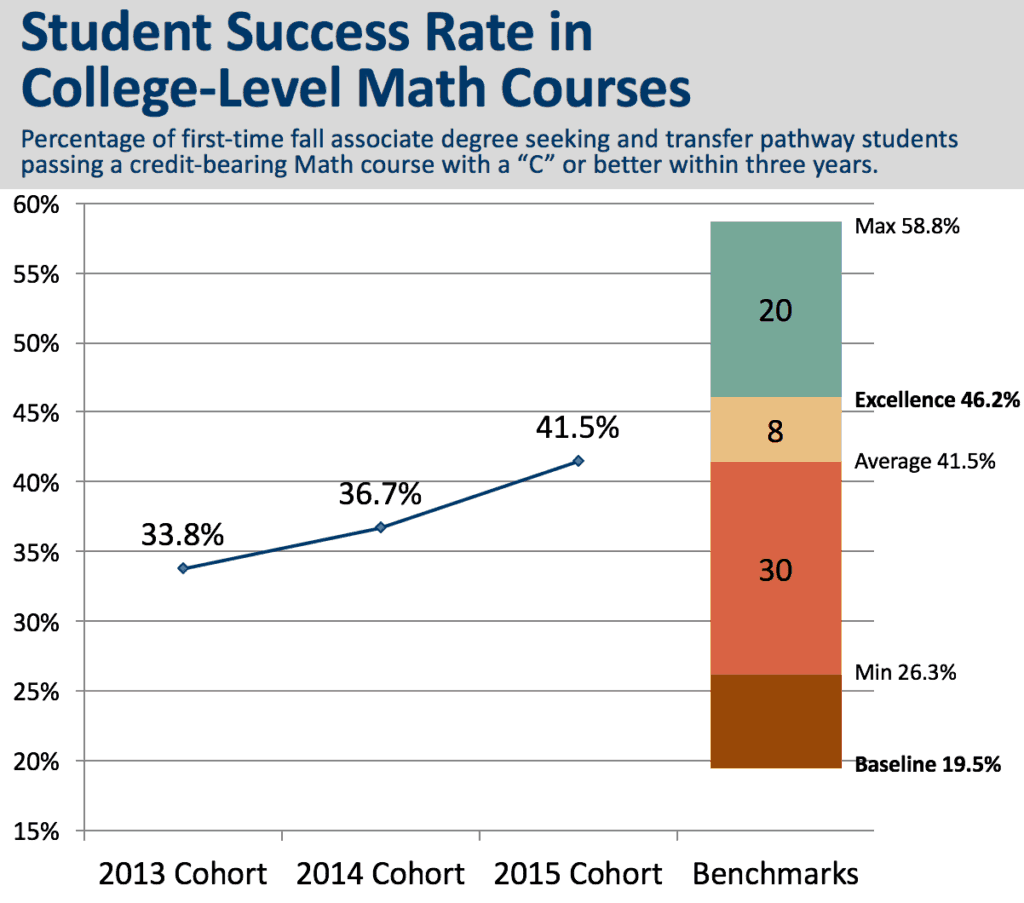
Twenty schools met or exceeded excellence, eight were below excellence but above average, and 30 were below average but below baseline. No schools were below baseline. The trajectory on this measure is upwards, with an increase from 33.8% in the 2013 cohort to 41.5% in the 2015 cohort.
First year progression
This category tracks first-time fall credential-seeking students who graduate or continue enrollment in postsecondary education before the next fall.
The system percentage on this measure is 67.2%, which is close to the average community college percentage of 68.2% and well above the baseline percentage of 56.6%. The excellence level in this category is 71.9%.
Nine schools met or exceeded excellence. Eighteen schools were below excellence but above average. Twenty-nine schools were below average but above the baseline. And two schools, Asheville-Buncombe Technical Community College and Robeson Community College, performed below baseline in this category.
The system totals have improved from 65.5% in 2015 to 67.2% in 2017.
Curriculum completion
This tracks the percentage of first-time fall credential-seeking curriculum students who graduate, transfer, or continue enrollment in their fourth year. The students must have 41 successfully completed non-development hours.
The system total for this category is 47.6%, which is close to the average community college percentage of 49.3% and well above the baseline of 34.1%. The excellence level for this category is 52.7%.
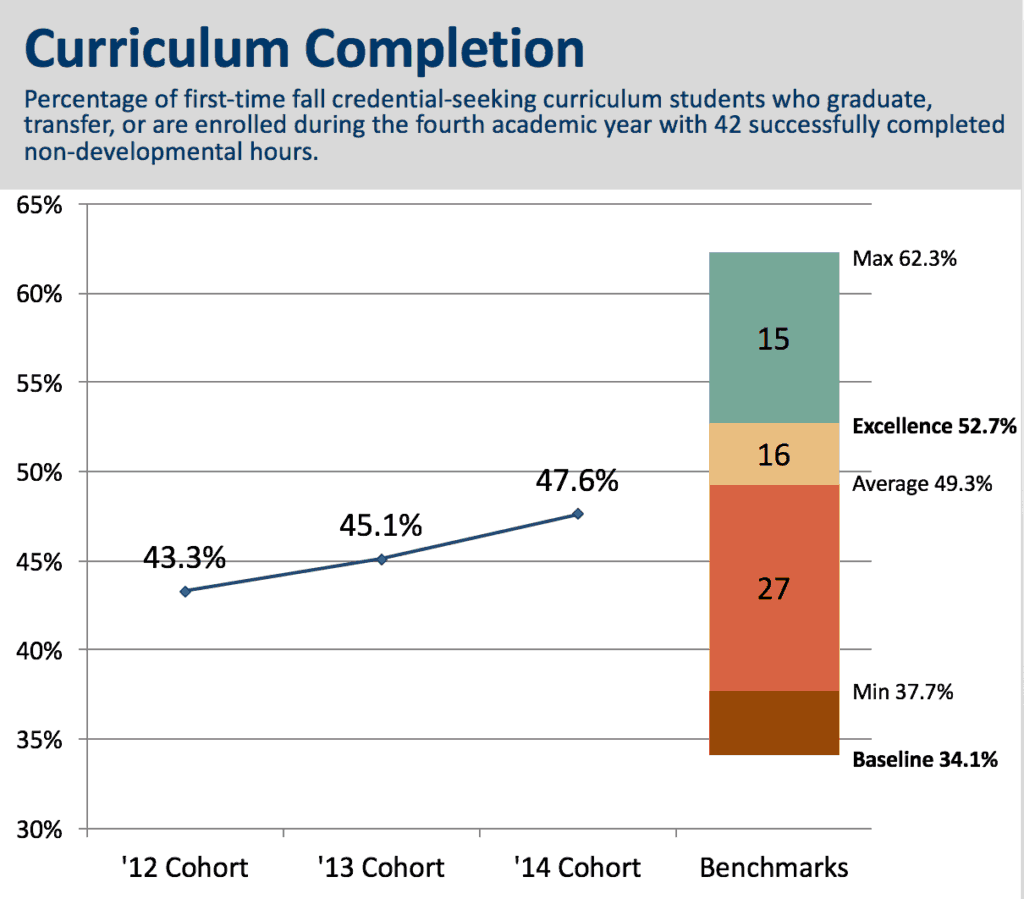
Fifteen schools met or exceeded excellence, 16 were below excellence but above average, and 27 were below average but above baseline. All schools performed above baseline in this category.
The chart above shows steady progression from a 43.3% system total in the 2012 cohort to a 47.6% system total in the 2014 cohort.
Licensure and certification passing rate
This category looks at students taking licensure and certification tests for the first time. The chart below uses a weighted index score where 0.98 represents the average community college score, 0.79 represents the baseline, and 1.07 is the excellence level.
The system total for this category was 1.0, which is above the average community college pass rate index.
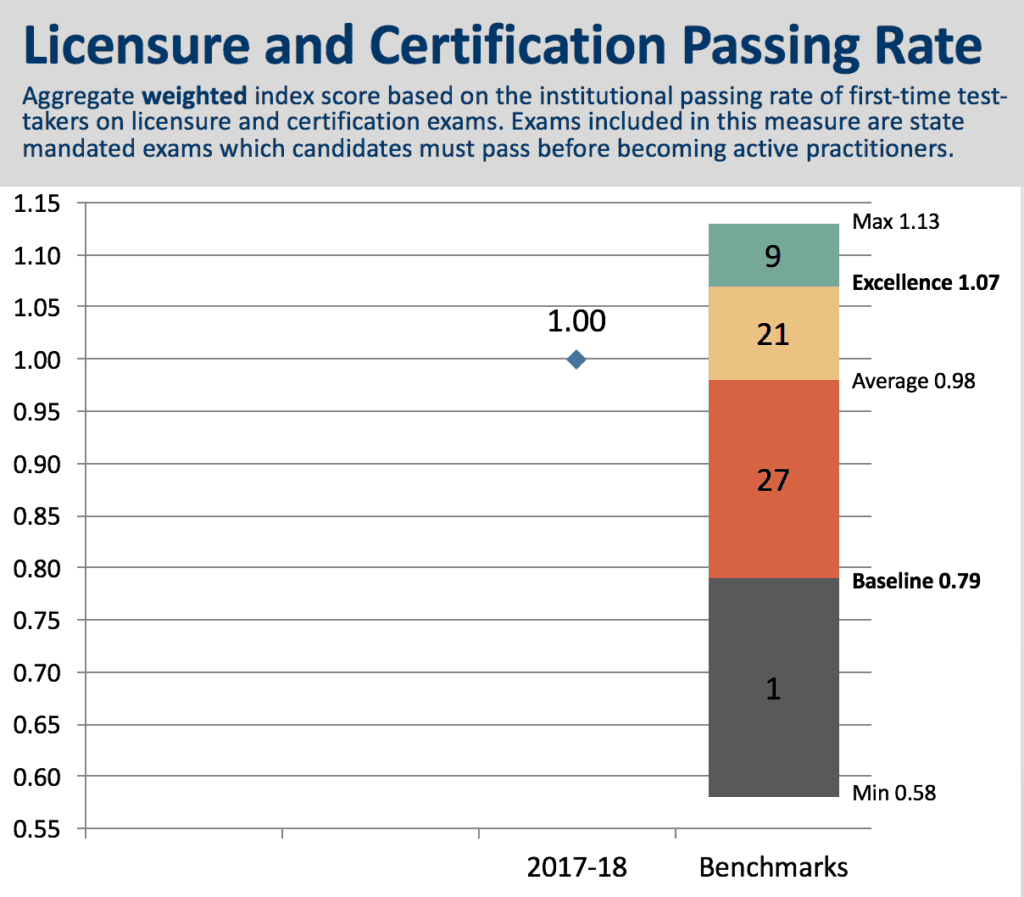
Nine schools met or exceeded excellence, 21 were below excellence but above average, and 27 were below average but above the baseline. One school, Pamlico Community College, performed below baseline in this category.
College transfer performance
The final category examines students who completed an associate degree or completed at least 30 transfer credits and transferred to a four-year university or college in the fall semester. It is looking at the percentage of those students who graduate before or remain enrolled in those universities and colleges the following fall semester.
The system total is 85.9%, which is above the average of 85.2% and well above the baseline of 74.4%. The excellence level is 89.4%.
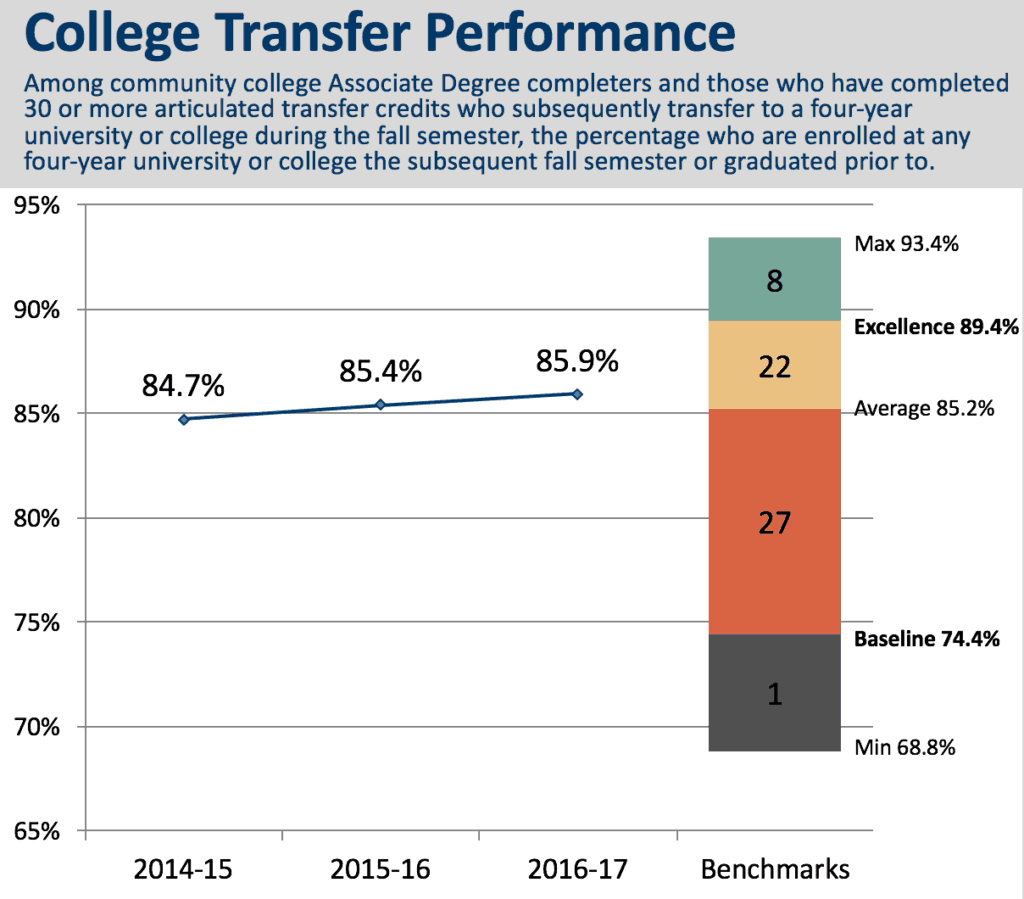
Eight schools met or exceeded excellence, 22 were below excellence but above average, and 27 schools were below average but above the baseline. One school, Pamlico Community College, performed below the baseline in this category.
The chart above shows the progression of the systems total from 84.7% in 2014-15 to 85.9% in 2016-17.
