This is an excerpt from “E(race)ing Inequities: The State of Racial Equity in North Carolina Public Schools” by the Center for Racial Equity in Education (CREED). Go here to read the full report and to find all content related to the report, including the companion report Deep Rooted.
Teacher quality has been consistently identified as the most important school-based factor in student achievement (McCaffrey, Lockwood, Koretz, & Hamilton, 2003; Rivkin, Hanushek, & Kain, 2000; Wright, Horn, & Sanders, 1997). Studies also show that teacher effects on student learning are cumulative and long-lasting (Kain, 1998; McCaffrey et al., 2003). For instance, Mendro (1998) found that students who have an outstanding teacher for just one year will remain ahead of their peers for approximately three years, while having an ineffective teacher for the same length of time has an equally negative long-term effect. Teacher effects also go beyond testing and achievement outcomes. Chetty, Friedman, & Rockoff (2011) showed that students assigned to high quality teachers are more likely to attend college and earn higher salaries and are less likely to have children as teenagers.
Given the clear relationship between teacher quality/effectiveness and a host of student outcomes, researchers have attempted to identify what defines and contributes to effective teaching practice. In this report, we focus on four dimensions of teacher quality/effectiveness:
- Qualifications (education, credentials, licensure),
- Experience,
- Turnover/retention, and
- Student-teacher racial/ethnic match.
Teacher qualifications
We discuss teacher qualifications as they relate to degree attainment, certification/licensure, and subject-matter education. Research has shown that measures of teacher preparation and certification are among the strongest predictors of student achievement in reading and mathematics, both before and after controlling for other relevant factors like student poverty and language status (Carr, 2006; Darling-Hammond, 2000). Furthermore, the policies of state and local educational agencies influence the overall level of teacher qualifications and capacities (Darlins-Hammond, 2000).
With regard to race/ethnicity, schools with higher proportions of students of color appear to be least likely to have qualified teachers (Clotfelter et al., 2005). Furthermore, studies have shown that highly qualified teachers were more likely to transfer out of schools with more students of color, leaving less qualified teachers concentrated in schools with higher proportions of students of color (Goldhaber, Gross, & Player, 2009). Jerald (2002) found that core academic classes in high-poverty secondary schools with more students of color are twice as likely to be taught by a teacher without a major or certification in the subject area compared to low-poverty schools with more White students.
Teacher experience and novice teachers
A substantial body of research shows that teaching experience is positively associated with student achievement gains (Kini & Podolsky, 2016). A longitudinal study from North Carolina covering a 10-year period found that a teacher’s experience, test scores, and licensure all have strong positive effects on student achievement and that teacher effects exceed those of class size or the socioeconomic characteristics of students (Clotfelter, Ladd, & Vigdor, 2007).
Students of more experienced teachers also appear to do better on other measures of success, such as school attendance, motivational factors, disciplinary outcomes, and outside of class reading behavior (Ladd & Sorenson, 2017; Balfanz, Herzog, & MacIver, 2007). Notably, more experienced teachers provided the greatest benefit to higher risk students, particularly in the area of attendance.
However, experienced teachers are not distributed equitably among schools, classrooms within schools, or student populations based on race/ethnicity and socioeconomic status (Clotfelter, Ladd, & Vigdor, 2005; Kalogrides & Loeb, 2013). Clotfelter, Ladd, Vigdor, and Wheeler (2007) analyzed a number of measures of teacher (and principal) qualifications and concluded that students in high-poverty schools are served by school personnel with lower qualifications than those in the lower poverty schools.
Disparities have also been documented in the distribution of novice teachers with less than three years of experience, who are generally less effective at raising student achievement compared with their more experienced peers (Rockoff, 2004). Studies have confirmed that districts with high proportions of students of color had higher proportions of novice teachers (Clotfelter et al., 2005; Kalogrides & Loeb, 2013). Even more concerning is evidence that the assignment of experienced/novice teachers operates as a “sorting function,” in which novice teachers are distributed among schools and among classrooms within schools in a way that disadvantages students of color and poor students and exposes them to lower quality teachers and less resourced classmates (Kalogrides & Loeb, 2013).
Teacher turnover and retention
Teacher turnover rates tend to be particularly high in schools serving low-income, students of color and low-achieving student populations (Hanushek, Kain, & Rivkin, 1999). Nationally, around 30% of teachers leave the profession within five years, and the turnover rate is typically above 50% in high-poverty schools (Darling-Hammond & Sykes, 2003; Ingersoll, 2001, 2003).
As might be expected, high turnover generally correlates negatively with student achievement outcomes (Guin, 2004; Ingersoll, 2001). Ronfeldt and colleagues (2013) found that students in grade levels with higher turnover score lower in both language arts and math. Effects were stronger in schools with more low-performing students and students of color. Moreover, research also suggests there is a “disruptive effect” to staff cohesion, community trust, and student engagement that extends far beyond individual classrooms (Ronfeldt, Loeb, & Wyckoff, 2013. p. 7).
The race/ethnicity of teachers also appears to play a role in turnover. Younger White teachers are more likely to leave schools when the proportion of teachers of color is larger. This pattern appears to diminish in older White teachers (older than 30) (Sohn, 2009). Given that roughly 80% of teachers are White, this poses a particular recruitment and retention challenge for schools with a diverse teaching staff.
Racial/ethnic match
A growing number of studies show that having a teacher of the same race/ethnicity as the student has a positive effect on student achievement, teachers’ behavioral assessments, graduation rates, and college enrollment (Bates & Glick, 2013; Dee, 2005; Egalite, Kisida, & Winters, 2015; Gershenson, Holt, & Papageorge, 2016). Research indicates that assignment to same-race/ethnicity teacher significantly increased the math and reading achievement of both Black and White students (Dee, 2005). In a study of the long-term effects of racial/ethnic matching, Gershenson, Hart, Hyman, Lindsay, and Papageorge (2018) found that Black students randomly assigned to a Black teacher in grades K-3 were five percentage points (7%) more likely to graduate from high school and four percentage points (13%) more likely to enroll in college than their peers in the same school who were not assigned a Black teacher.
To explain the effects of racial/ethnic matching, scholars often point to role-model effects for students of color, as well as substantial evidence of racial biases among White teachers (Dee, 2005; Gershenson, Hart, Hyman, Lindsay, & Papageorge, 2018). Bates and Glick (2013) studied behavioral assessments of an individual child by multiple teachers and found that Black children receive worse assessments of their externalizing behaviors (e.g. arguing in class and disrupting instruction) when they have a non-Hispanic White teacher than when they have a Black teacher even when controlling for the effects of school context and the teacher’s own ratings of overall class behavior. Non-Black teachers also appear to have significantly lower academic expectations of Black students, particularly for Black males in math classes (Gershenson, Holt, & Papageorge, 2016).
Methodology
Given the profound effects that teachers have on virtually all educational outcomes, we position students’ exposure to experienced, qualified teachers and same-race/ethnicity teachers as a powerful indicator of access and opportunity. In the sections that follow, we present an examination of over 75,000 teachers, roughly 1.5 million students, and approximately 8.5 million courses during the 2016-2017 school year. We report teacher demographics1, experience, and qualifications. We also report the exposure of different racial/ethnic groups to different levels of teacher qualifications, experience, and turnover. In addition, we examine how the percentage of students of color in a school affects the distribution of those teacher traits. We look at racial equity in the context of North Carolina teachers from two angles:
- School-level means of teacher traits by the proportion of students of color, and
- the racial/ethnic designations of students in courses taught by teachers.
Analysis
Figure 1.1 shows the gender and race/ethnicity of North Carolina teachers.
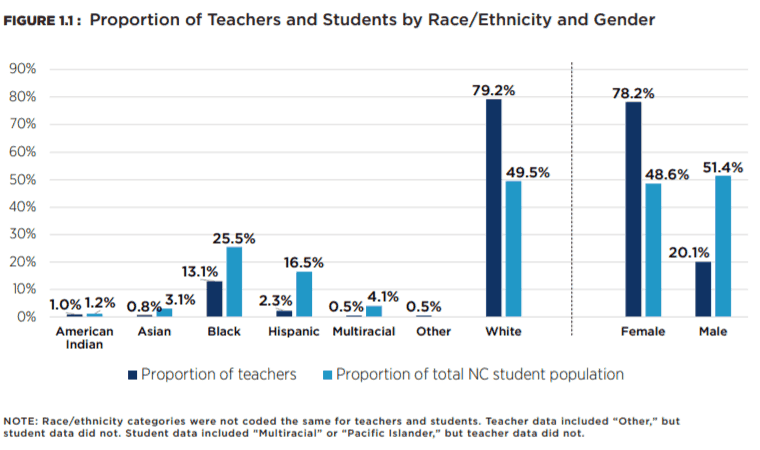
Over 78% of teachers were female while only 49% of students were female. Almost 80% of teachers were White, 13% were Black, and the remainder were split between American Indian (1%), Asian (0.8%), Hispanic (2.3%), and Other (0.5%). When we compare the proportion of teachers belonging to a racial/ethnic group to the proportion of students belonging to the same group, Whites are dramatically over-represented in the teaching force while the remaining racial groups are all under-represented.
The difference in proportions between Hispanic teachers and students is notably large. The proportion of students that are Hispanic is over 7 times the proportion of teachers that are Hispanic. Asian students are roughly 3 times the proportion of Asian teachers, and Black students about double the proportion of Black teachers.
Qualifications
Virtually all (> 99.8%) classroom teachers in North Carolina had a bachelor’s degree (or higher) in 2016-2017. Years of experience ranged from 0-58 years with a mean of 13.6 years and a median of 13 years.
The majority of teachers were qualified as well. Over 80% of teachers were highly qualified, and only 0.5% (353 teachers) were not highly qualified. Approximately 18% of teachers had no determination of quality. A closer examination of teachers that were not highly qualified reveals that, in aggregate, they have higher levels of degree attainment and years of experience than highly qualified teachers. Only 38 of the 353 not highly qualified teachers were novice with three or fewer years of experience. This suggests that this small subset of not highly qualified teachers are well educated and experienced but are teaching outside of their degree area.
Nonetheless, we examined which types of schools and students were taught by teachers that were not highly qualified. Asian and Pacific Islander students have the highest exposure to unqualified teachers. Black, Hispanic, Multiracial, and White students are similarly exposed to unqualified teachers, and American Indian students have the lowest exposure to unqualified teachers. These differences were statistically significant. Approximately 305 schools (12%) contained at least one unqualified teacher. Schools with at least one unqualified teacher had a higher proportion of students of color than those without an unqualified teacher (~53% vs. ~51%).
Of course, the glaring issue with adequately examining teacher qualifications is the large number of teachers (over 14,000) for which there was no determination of quality. While the data give no clear answer as to why there is no information on quality for these teachers, examining the patterns of missing data suggests that a subset of schools and districts either failed to report the data, or the data from those agencies were not recorded.
Teachers with unknown qualifications have higher mean years of experience (15.6 vs. 13.6 years) but are more likely to be novice teachers (16.6% vs. 15.7%) and less likely to have a bachelor’s degree or higher (95.8 vs. 98.9). Such mixed results leave it unclear as to whether teachers with unknown qualifications are more or less qualified in aggregate.
Despite the inherent limitations, we compared the racial/ethnic composition of schools with known vs. unknown teacher qualifications. The data show that schools in which teacher qualifications are unknown tend to have higher proportions of students of color than schools in which teacher qualifications are known. We should reiterate that the vast majority (>99.9%) of teachers with known qualifications are highly qualified. Remaining mindful of the lack of clarity around teacher qualifications, these results may suggest that students of color are over-exposed to less qualified teachers.
Novice teachers
Almost 12,000 teachers (~16%) fell into the category of “novice” in 2016-2017, defined as having three or fewer years of teaching experience. Novices taught just over 20% of student course sections. Black students had the highest proportion of course sections taught by novice teachers at approximately one in four (25%). About 22% of courses taken by Hispanic and American Indian students were taught by a novice compared to 20% of courses taken by Asian, Multiracial, and Pacific Island students. Just over 17% of courses taken by White students were taught by a novice.
We also built prediction models that predicted the likelihood of a student course section being taught by a novice teacher. Figure 1.2 presents the results of the prediction models. Model 1 represents the likelihood of being taught by a novice teacher for each racial/ethnic group as compared to White students. Model 2 shows the likelihood of being taught by a novice teacher for each racial/ethnic group while controlling for other relevant factors, including gender, free/reduced lunch status, language status, and special education status.
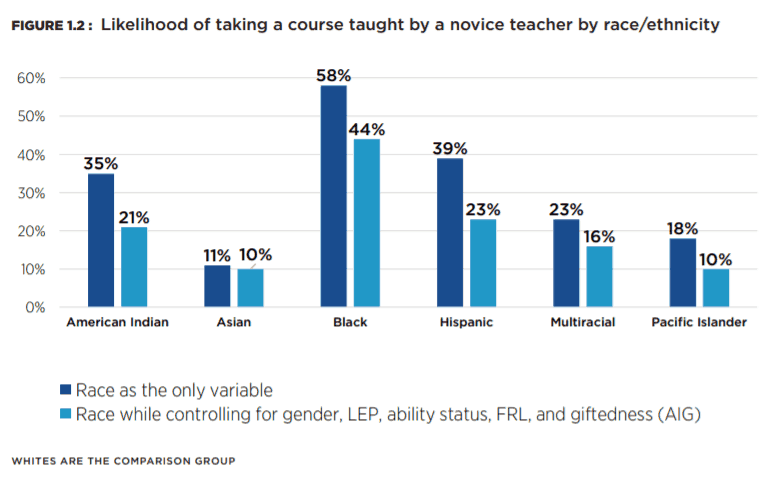
Race/ethnicity is a significant and substantial predictor of exposure to novice teachers after accounting for other factors. All student groups of color are more likely to be taught by a novice teacher than their White counterparts. The odds for Black students are almost double those of the next highest racial/ethnic group (Hispanic). Of all variables in the model (race/ethnicity, gender, language status, special education status, free/reduced lunch status), being Black was by far the strongest predictor of exposure to a novice teacher.
We also looked at the percentage of course sections taught by novice teachers at each school as a factor of the proportion of students of color in the school. We divided schools into quarters representing 0-25%, 26-50%, 51-75%, or 76-100% students of color. As seen in Table 1.1, schools with higher proportions of students of color do not generally have higher proportions of novice teachers.
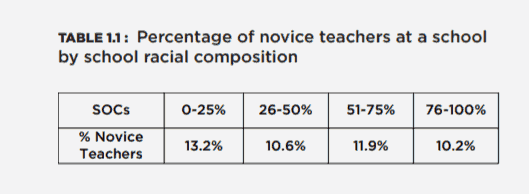
Indeed, schools with the lowest percentage of students of color (0-25%, i.e. more White students) appear to have the highest percentage of novice teachers in aggregate. It should be noted, however, that the differences in novice teacher percentage between students of color percentage are not statistically significant, indicating that the observed differences shown in Table 1.1 may well be due simply to chance.
This finding is interesting given the above model predicting that students of color are more likely to take courses taught by novice teachers. Taken together, these results suggest that the sorting of students from different racial/ethnic groups between novice and experienced teachers is conducted to a greater extent within schools rather than between them.
We also examined overall teacher experience by racial composition. Schools had similar mean levels of teacher experience regardless of the proportion of students of color.
Racial/ethnic match
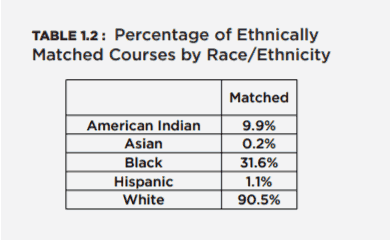
Across approximately five million student course sections, we identified substantial differences in teacher-student racial match. Almost nine out of 10 courses taken by White students were taught by a White teacher. About 1 in 3 course sections taken by Black students was taught by a Black teacher. American Indians were taught by same-race/ethnicity teacher in approximately 1 out of 10 course sections. About 1 in 100 Hispanic student course sections and approximately 2 in 1000 Asian student course sections were racial/ethnically matched. We were unable to analyze the ethnic match of Multiracial and Pacific Islander students because the state does not collect data on teachers from those race categories.
Teacher turnover and vacancy
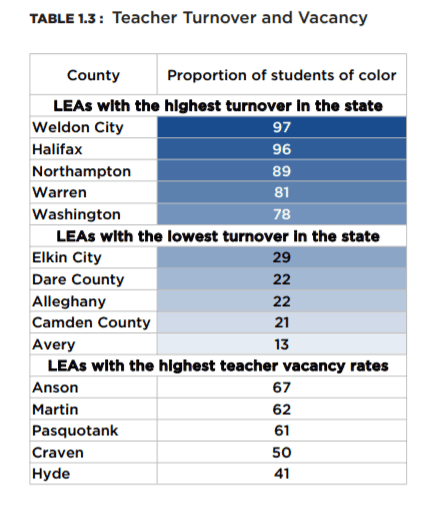
As required by statute [NC General Statute § 115C-12 (22)], the North Carolina Department of Public Instruction submits a yearly report on teacher turnover and vacancy data to lawmakers. We present statistics from the 2016-2017 State of the Teaching Profession in North Carolina (Public Schools of North Carolina State Board of Education Department of Public Instruction, 2018) report rather than results of our own analysis of raw data. Data was reported in tabular form by district or local educational agency (LEA) for teacher turnover. Only the counties with the highest vacancy rates were reported.
To assess the exposure to attrition and turnover rates, we compared the racial composition of the five counties/LEAs with the highest turnover rates to the five with the lowest rates. The counties/LEAs with the highest teacher attrition rates all had over 78% students of color, while those with the lowest attrition had under 30%. The mean proportion of students of color in the districts with the highest vacancy rate was 56.2%. The proportion of students of color statewide in 2016-2017 was 51.6%.
Takeaways
Research makes it clear that a highly qualified, experienced, stable, and diverse teaching corps is best positioned to meet the educational needs of North Carolina’s diverse student population. Our analysis demonstrates that there are substantial differences in exposure to highly qualified, experienced, stable, and diverse teachers based on the race/ethnicity of students and the racial composition of classrooms, schools, districts and LEAs. While the vast majority of teachers for whom we have data are highly qualified, we found that students of color are overexposed to teachers that are not highly qualified and to teachers with unknown qualifications. While students from different racial/ethnic groups were taught by teachers with similar aggregate mean years of experience, all student groups of color took a higher percentage of courses from novice teachers than White students. Student groups of color also had a higher likelihood of being taught by a novice as compared to their White counterparts when controlling for gender, free/reduced lunch status, language status, and special education status. However, at the school level, those with the lowest percentage of students of color (0-25%) had the highest percentage of novice teachers. These results support previous literature (Clotfelter et al., 2005; Kalogrides & Loeb, 2013) in suggesting that schools and districts sort students into the classrooms of novice and experienced teachers based on race/ethnicity and socioeconomic status, and that this sorting proceeds to a greater extent within schools rather than between them. All student groups of color were also far less likely to be in classes with a teacher of the same race/ethnicity. Finally, students of color were strongly over-represented within the districts/LEAs with the highest teacher turnover and vacancy rates.
Given the powerful influence that teachers have on virtually all measures of educational success, our results provide evidence that students of color in North Carolina have less access to the highly qualified, experienced, stable, and diverse teachers that are likely to provide them with the best chance of school success.
References
Balfanz, R., Herzog, L., & \ MacIver, D. J. (2007). Preventing student disengagement and keeping students on the graduation path in urban middle-grades schools: Early identification and effective interventions. Educational Psychologist, 42(4), 223–35.
Bates, L. A., & Glick, J. E. (2013). Does it matter if teachers and schools match the student? Racial and ethnic disparities in problem behaviors. Social science research, 42(5), 1180-1190.
Carr, M. (2006). The determinants of student achievement in Ohio’s public schools (Policy Report). Columbus, OH: Buckeye Institute for Public Policy Solutions. Retrieved February 28, 2008, from http://www.buckeyeinstitute.org/docs/Policy_Report_-_Determinants_of_Student_Achievement_in_Ohio.pdf
Chetty, R., Friedman, J. N., & Rockoff, J. E. (2011). The long-term impacts of teachers: Teacher value-added and student outcomes in adulthood (No. w17699). National Bureau of Economic Research.
Clotfelter, C. T., Ladd, H. F., & Vigdor, J. L. (2007). Teacher credentials and student achievement: Longitudinal analysis with student fixed effects. Economics of Education Review, 26(6), 673-682.
Clotfelter, C. T., Ladd, H. F., & Vigdor, J. (2005). Who teaches whom? Race and the distribution of novice teachers. Economics of Education Review, 24(4), 377-392.
Clotfelter, C., Ladd, H., Vigdor, J., & Wheeler, J. (2007). High-Poverty Schools and the Distribution of Teachers and Principals (Working Paper 1). Washington, D.C.: National Center for Analysis of Longitudinal Data in Education Research (CALDER), Urban Institute. Retrieved February 19, 2010, from http://www.caldercenter.org/PDF/1001057_High_Poverty.pdf.
Darling-Hammond, L. (2000). Teacher quality and student achievement. Education policy analysis archives, 8, 1.
Dee, T. S. (2005). A teacher like me: Does race, ethnicity, or gender matter?. American Economic Review, 95(2), 158-165.
Egalite, A., Kisida, B., & Winters, M.A. (2015). Representation in the classroom: The effect of own-race teachers on student achievement. Economics of Education Review, 45, 44-52.
Gershenson, S., Hart, C., Hyman, J., Lindsay, C., & Papageorge, N. W. (2018). The long-run impacts of same-race teachers (No. w25254). National Bureau of Economic Research.
Gershenson, S., Holt, S. B., & Papageorge, N. W. (2016). Who believes in me? The effect of student–teacher demographic match on teacher expectations. Economics of Education Review, 52, 209-224.
Goldhaber, D., Gross, B., & Player, D. (2009). Teacher Career Paths, Teacher Quality, and Persistence in the Classroom: Are Schools Keeping Their Best? CALDER Working Paper No. 29. Washington, D.C.: National Center for Analysis of Longitudinal Data in Education Research.
Hattie, J. (2003). Teachers make a difference: What is the research evidence? Australian Council for Educational Research: Annual Conference on Building Teacher Quality. Melbourne.
Lee, S. W. (2018). Pulling back the curtain: Revealing the cumulative importance of high-performing, highly qualified teachers on students’ educational outcome. Educational Evaluation and Policy Analysis, 40(3), 359-381.
Jerald, Craig (2002). All Talk, No Action: Putting an End to Out-of-Field Teaching. Washington, D.C.: The Education Trust.
Kalogrides, D., & Loeb, S. (2013). Different teachers, different peers: The magnitude of student sorting within schools. Educational Researcher, 42(6), 304-316.
Kini, T., & Podolsky, A. (2016). Does teaching experience increase teacher effectiveness. A review of the research. Washington, D.C.: Learning Policy Institute. Retrieved from https://learningpolicyinstitute.org/sites/default/files/product-files/Teaching_Experience_Brief_June_2016.pdf
Ladd, H. F., & Sorensen, L. C. (2017). Returns to teacher experience: Student achievement and motivation in middle school. Education Finance and Policy, 12(2), 241-279.
Mendro, R. L. (1998). Student achievement and school and teacher accountability. Journal of personnel évaluation in éducation, 12(3), 257-267.
Public Schools of North Carolina State Board of Education Department of Public Instruction. (2018, February). 2016-2017 State of the teaching profession in North Carolina. Raleigh, NC: Public Schools of North Carolina State Board of Education Department of Public Instruction. Retrieved from http://www.ncpublicschools.org/docs/district-humanresources/surveys/leaving/2016-17-state-teaching-profession.pdf
Ronfeldt, M., Loeb, S., & Wyckoff, J. (2013). How teacher turnover harms student achievement. American Educational Research Journal, 50(1), 4-36.
Sohn, K. (2009). Teacher turnover: An issue of workgroup racial diversity. education policy analysis archives, 17, 11.
Rockoff, J. (2004). The impact of individual teachers on student achievement: Evidence from panel data. American Economic Review, 94, 247–252.
Editor’s note: James Ford is on contract with the N.C. Center for Public Policy Research from 2017-2020 while he leads this statewide study of equity in our schools. Center staff is supporting Ford’s leadership of the study, conducted an independent verification of the data, and edited the reports.


