Share this story
 |
EdNC just released our latest map on school performance grades across North Carolina, thanks to our favorite mapper Emily Antoszyk. She has been mapping school grades for us since 2015.
Read this article to see the map, read about how the map works (note you can filter by district or school), and see past maps.
Our map gives you control
The power of our map is that it gives you control. Currently, according to legislation, academic achievement makes up 80% of a school’s grade, and school growth makes up the other 20%. With our map, you get to choose the percentages based on your values to see how the grades change — statewide and for particular schools.
Take a look at the map, and then create your own map. Take a screenshot and share it with us on X, @EducationNC.
This is the map with 80% achievement and 20% growth and the 15-point scale as required by law. Notice the number of A, B, C, D, and F grades below the map as the formula is changed.
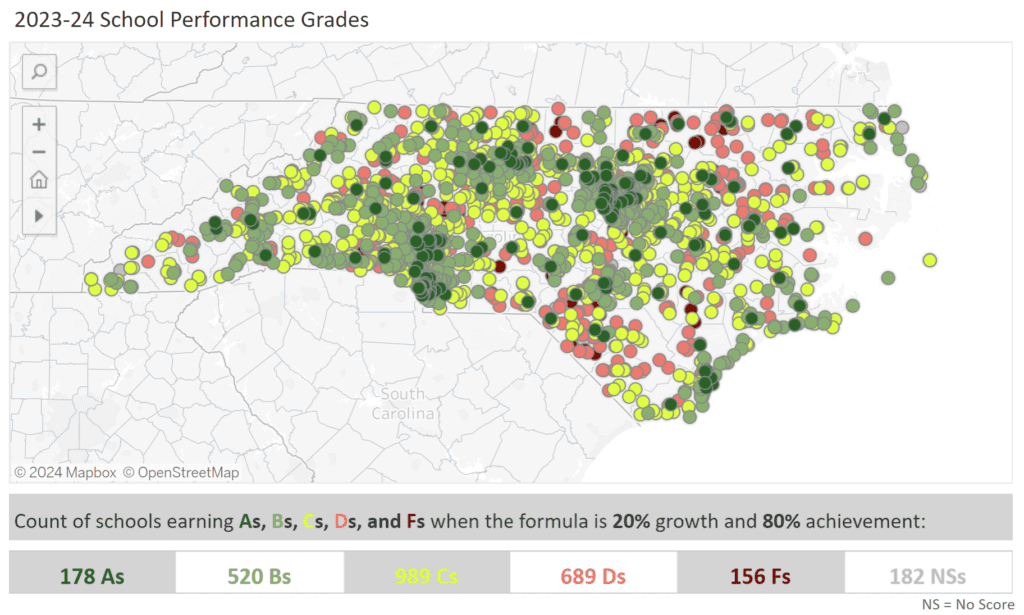
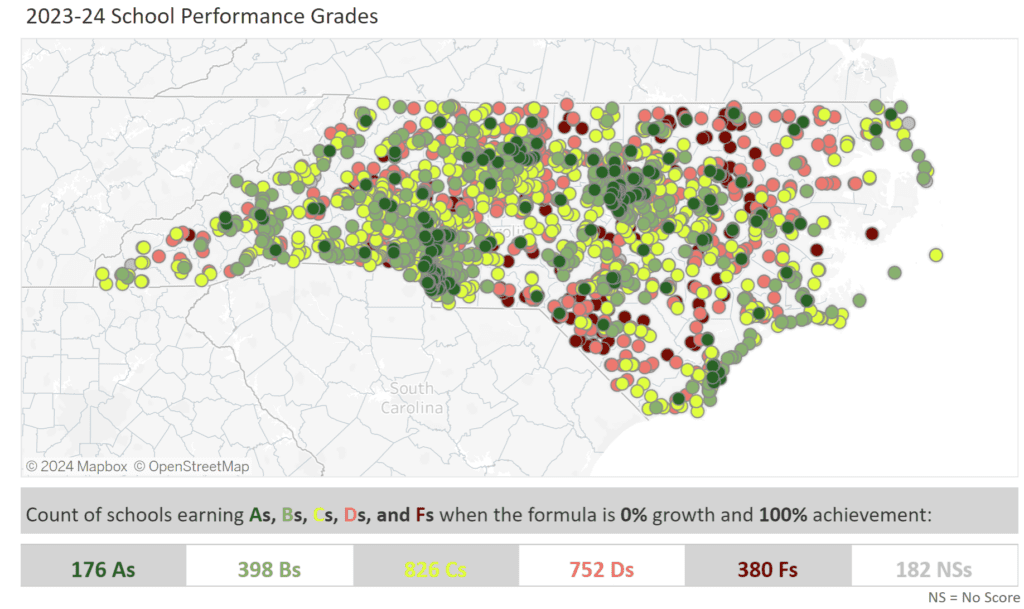
This is the map with 100% achievement.
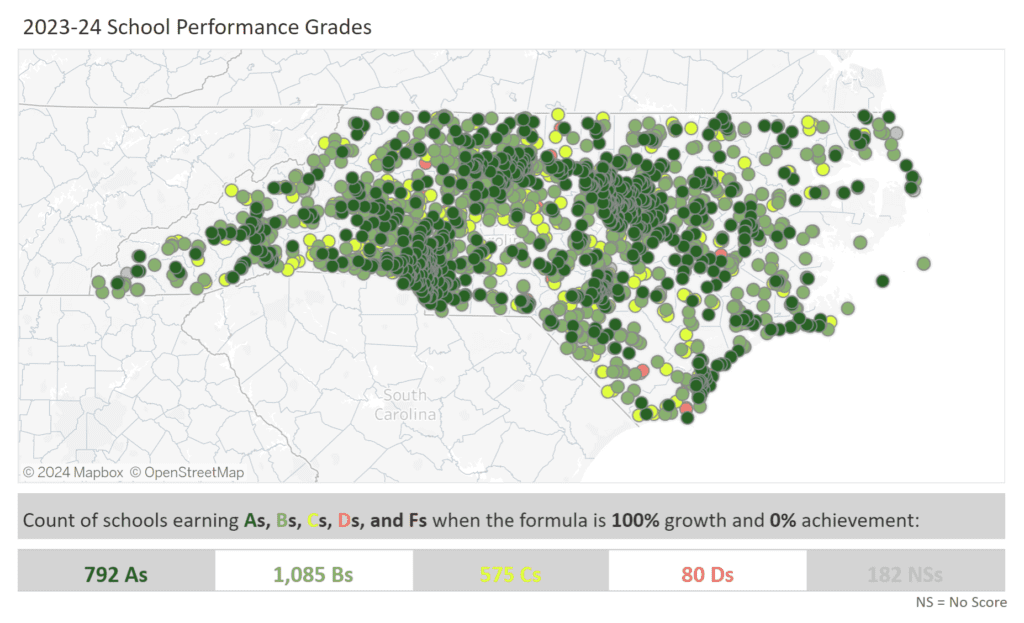
This is the map with 100% growth. There are no F schools with this formula.
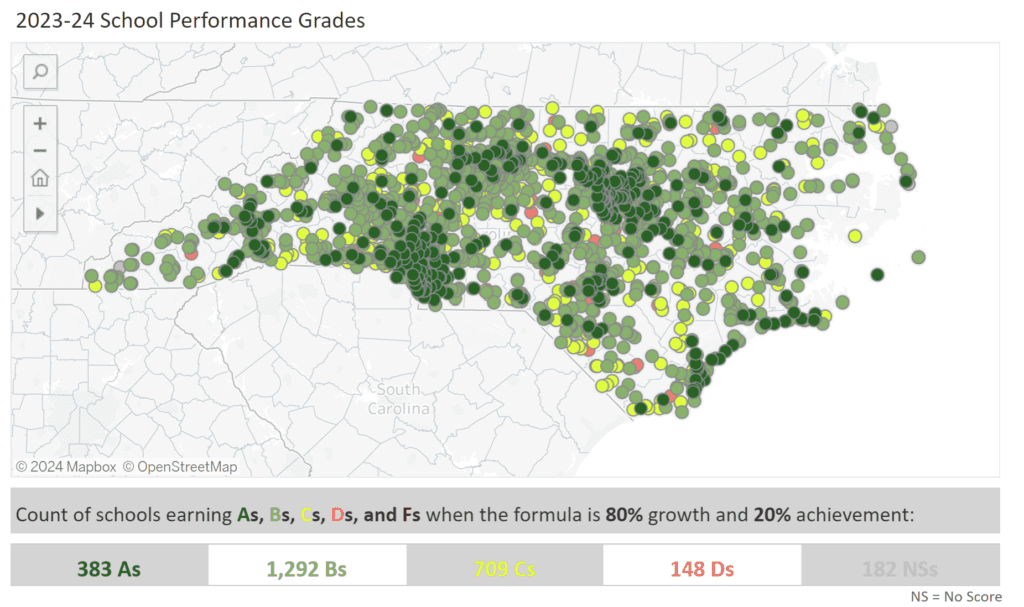
This is the map with 20% achievement and 80% growth. There are no F schools with this formula.
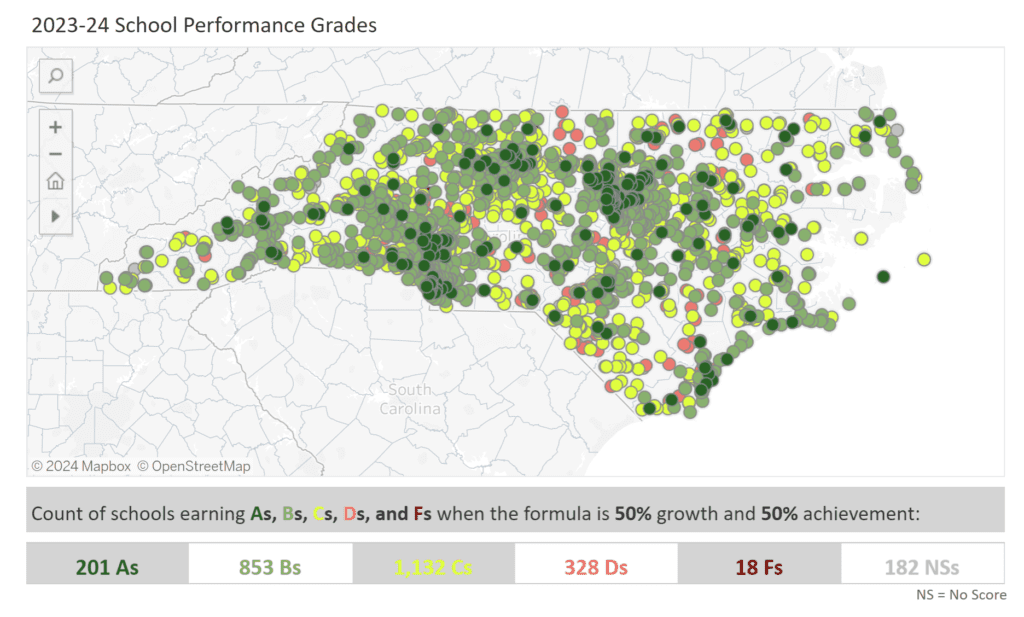
This is the map with 50% achievement and 50% growth. There are 18 F schools with this formula.
EdNC worked with Antoszyk to create this map to empower all of you to take a deeper look at how these public policy choices — to have school grades and to use the existing 80/20 split — impact our perception of our local public schools.
Other states and school accountability
The Education Commission of the States provides this 50-state resource on school accountability systems, which was updated on Sept. 29, 2024. Here is North Carolina’s state profile.
The resource finds, “States most commonly rate school performance using Descriptive Ratings (13 states), Index Ratings (12 states and the District of Columbia) and Federal Tiers of Support (14 states). Six states use A-F ratings and four states use 1-5 star ratings.”
North Carolina is one of the six states that continues to use A-F ratings.
DPI has proposed a new model
In 2022, the N.C. Department of Public Instruction (DPI) convened an advisory group to consider changes in testing and accountability. In partnership with DPI, we conducted a survey on school performance grades, and more than 26,000 participants weighed in.
Under the proposed model that emerged, schools would receive four different grades. Those four grades, listed below, would not be combined into one single letter.
- Opportunity. This grade would measure chronic absenteeism, school climate, and intra/extracurricular activities.
- Academics. Across all grades, this would measure proficiency in math, science, and reading.
- Progress. This grade would measure a school’s growth, based on EVAAS data.
- Readiness. Across K-12, this grade would measure postsecondary preparation. In middle school, it would also include career development plans. In high school, it would also include postsecondary outcomes and graduation rates.
This proposed model would require legislative action.
EdNC’s reporting on the new model proposed by DPI


What matters to you?
To parents wondering how to think about the letter grade of your child’s school, start by considering how your child is doing at school. When my child attended a “D” school, here is how I thought about it.
If your child is not doing well at a school, then that is a problem. But the letter grade is not a problem in and of itself, and flight from a school just because of the letter grade is not the answer. As always, we need our parents to circle in and invest your time, energy, and resources in our schools in positive ways so that every child has access to a high-quality education.
We hope parents, educators, school administrators, and policymakers will use our map and this research to imagine a school accountability system you’d believe in and to participate in a conversation about how our current system of measuring school performance should be changed.
And remember, you aren’t limited to achievement and growth! What matters to you?