|
|
Arts education can provide inspiration, important skills, and even future career opportunities for students. During the 2021-22 school year, there were more than 1.1 million art students in North Carolina public schools, according to data from the North Carolina Arts Education Leadership Coalition (AELC).
However, more than 23,000 North Carolinian students lacked access to any arts in their schools during the same time range, according to the AELC data.
A report from the NAMM Foundation found that students in the United States are less likely to have access to arts education if they attend schools that are majority Black, Hispanic, or Native American, have the highest percentage of students eligible for free- and reduced-price meals, or are located in rural or highly urban areas.
Which students in North Carolina have access to arts? The AELC published interactive maps and data so users can explore data related to student access to arts education at the state, district, county, and school level.
The project features information on four arts disciplines: theater, dance, music, and visual art.
According to their website, AELC is “a statewide coalition of professional arts organizations addressing the needs of K-12 arts education in North Carolina.”
“We envision high-quality, standards-based instruction in arts education, integrated throughout the curriculum and taught by licensed arts educators to develop student creativity and innovation while effectively engaging, retaining, and preparing future-ready students for graduation as lifelong arts supporters, consumers, and creators,” AELC’s website says.
How to navigate
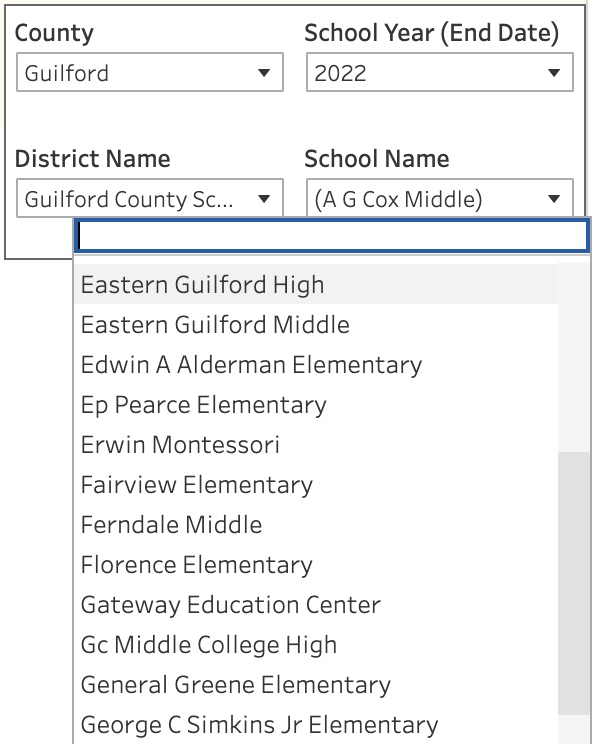
The website includes a data dashboard with instructions on how to navigate the arts education data project, as well as helpful definitions and tips.
To navigate through the arts education data project, you can click on the dashboard tab featuring the data you wish to view. The various data dashboards can be accessed on AELC’s main table of contents page or via the gray, labeled tabs at the top of the project page.
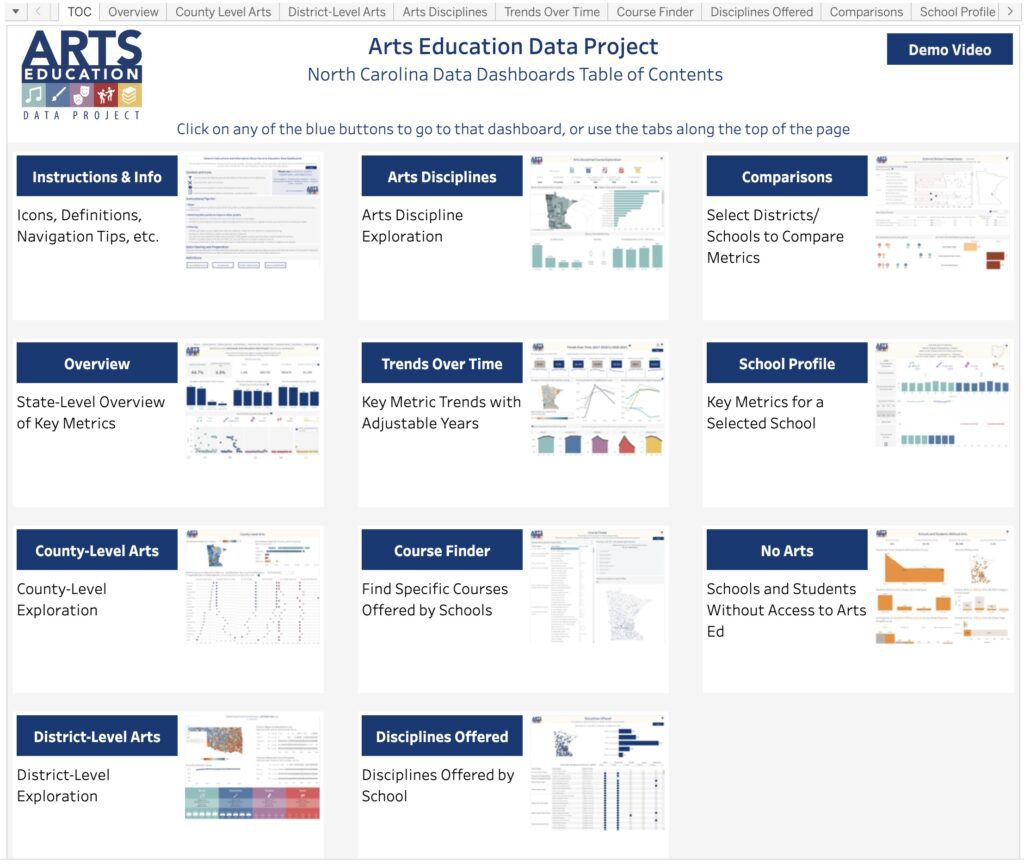
To view a specific school’s arts education profile, click on the “school profile” tab. Select the funnel-shaped icon in the top right-hand corner to access a menu, which will allow you to choose your desired county, district, and school, as well as the year for the data you wish to see.
Once your school is selected, the dashboard will display the school’s name along with information on its population and demographics. Columns separate data by discipline (theater, dance, music, and visual arts), while rows display categories for data such as the number of arts teachers or trends for enrollment in arts courses.

You can click or hover your mouse over a data item to learn more information about it.

You can also explore arts data at the county level by selecting the “county level arts” tab. The dashboard will display a heat map of North Carolina with the color of each county, reflecting the rate at which students are enrolled in arts courses. Hovering over a county reveals its specific enrollment data.
You can view data on enrollment by discipline in each county as well as the percentage of students in the county who don’t have access to arts education.
Similar information on the district level can be accessed under the “district-level arts” tab where data on race, ethnicity, and free- and reduced-lunch enrollment is also available.
If a specific area is not selected in the county-level or district-level dashboards, statewide information will be displayed.
The “trends over time” tab allows you to view trends in arts education enrollment from the 2017-2018 school year to the 2021-2022 school year. Hover over your county on the featured map of North Carolina to view the percent change in arts enrollment.
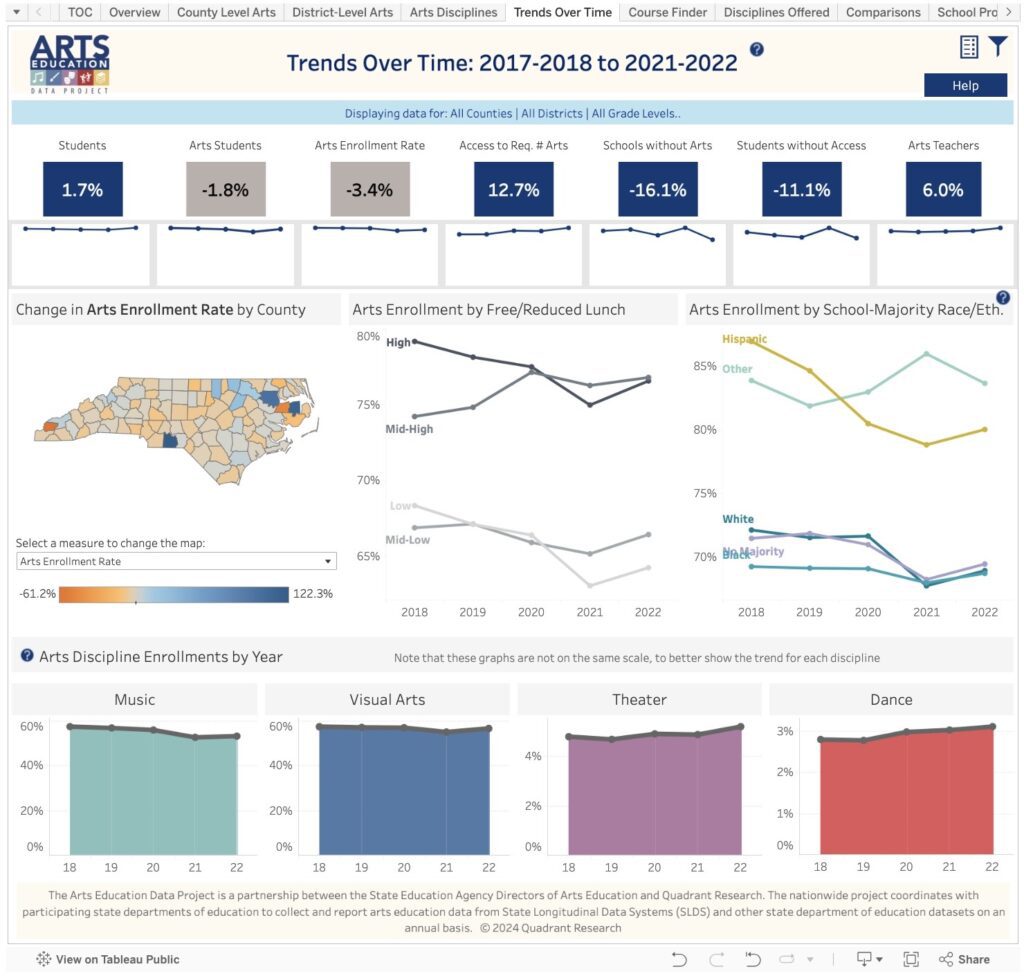
The arts enrollment rate in North Carolina fell by 3.4% from 2017-2018 to 2021-2022. However, in that time frame, the number of schools without arts programs decreased by 16.1%, and the number of students without access to arts fell by 11.1%.
To see detailed enrollment trends for a specific school district or county, you can click the funnel icon in the top right-hand corner to select a district, county, and time frame. You can also choose to view trends for specific school levels including elementary school, middle school, and high school.
Play around with the dashboard and let us know what you see. For more stories about arts education in North Carolina, go here.


