When test results came out at the State Board of Education meeting earlier this month, many fears about academic performance during the pandemic were confirmed. As reported by EducationNC’s Anna Pogarcic, “Student scores were down across all year-end tests. In many of the assessments, fewer than half of the students were meeting grade-level expectations.”
Given the pandemic, caution is the order of the day when looking at these test scores, but the scores will inform strategies for academic recovery.
So what happens when you drill down into the data district by district?
EducationNC put together this spreadsheet to analyze the data. In it, you can find the percent of students who scored a 3 or above on their year-end tests by school and district. Scoring a 3 is considered being grade-level proficient.
The schools are organized by district, and there is a separate tab for 2018-19 and 2020-21. There is also a tab that shows the percent of students who scored 3 or above by district and another tab that shows the percent change from 2018-19 to 2020-21 for all schools.
![]() Sign up for the EdWeekly, a Friday roundup of the most important education news of the week.
Sign up for the EdWeekly, a Friday roundup of the most important education news of the week.
District test score data
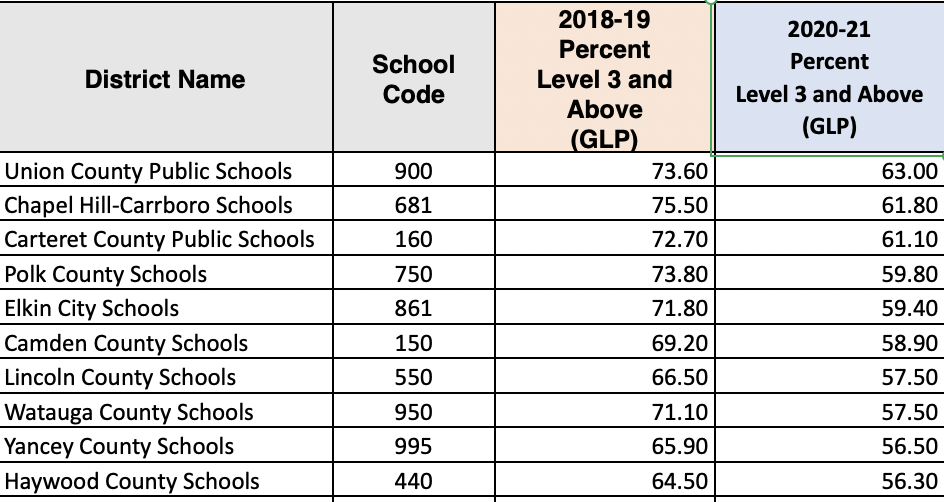
If you’re only comparing districts, then Union County Public Schools performed best in 2020-21. Sixty-three percent of students scored a 3 or higher. That 63% is down from 73.6% in 2018-19. Union was the third-highest scorer in 2018-19.
Chapel Hill-Carrboro was the highest scorer in 2018-19, with 75.5% of students scoring a 3 or higher. That percent dropped to 61.8% in 2020-21 and Chapel Hill-Carrboro dropped to second.
We’ve had questions about how charter schools fared as a whole. They were 40th in the state in 2020-21 with about 48% of students scoring on grade level or better, and they were 39th in 2018-19, with about 61%.
Here are the top-performing districts in 2020-21:

No districts in the state, nor charter schools as a whole, did better in 2020-21 than in 2018-19. Statewide, student scores dropped 13 percentage points on average.

Forty-eight districts, including charter schools as a whole, had a higher share of students scoring a 3 or higher on year-end tests in 2020-21 than the state as a whole. In 2018-19, that number was 51, also including charter schools.
Note 103 schools, from multiple districts, either had no change in scores or improved between 2018-19 and 2020-21.
What does it all mean?
Melissa Merrell, chair of the Union County Public Schools Board of Education, said the district’s emphasis on in-person learning and test preparation are prime contributors to the district’s performance.
She said that at every step of the way, the district let students attend in person as much as the state would allow. And she said that all employees, including substitutes, were offered a COVID-19 vaccine in February and March. When school started back up after spring break, the school board voted to go five days a week to help prepare for end-of-grade and end-of-course tests, providing tutoring and remediation for students who may have fallen behind.
Merrell said that while the year-end test scores are “significantly lower than what Union County is accustomed to,” the district’s strategy worked.
“We are extremely proud of our students, our teachers, our administrators, that really went above and beyond during a global pandemic,” she said.
But Michael Maher, executive director of the Office of Learning Recovery & Acceleration at the North Carolina Department of Public Instruction (DPI), said caution is warranted.
“What I’m a little bit worried about is drawing real comparisons between groups, either districts or students, right now,” he said, adding later, “The decline is real. The magnitude we’re not quite sure of yet.”

There are a variety of reasons Maher thinks analysis should move carefully. For one, the sample size isn’t the same — fewer students took year-end tests in 2020-21 compared to previous years. It’s also difficult to determine whether a district’s performance is indicative of what analysts would have expected from it anyway or if there is some particular response to teaching during the pandemic.
He said his office plans to take a deep dive into the data, looking at performance relative to a variety of items, including demographics, districts, urbanicity, modes of instruction, and more. If there are districts or schools that performed better than expected, DPI is going to want to know what they did to achieve that. But, he said, the analysis is going to take a while. He expects to have preliminary results by December and report to the State Board of Education by March 2022.
“I know that’s not tomorrow, which is what everybody wants, but certainly we’re going as quickly as we can,” he said.
Maher said he is also interested in collecting more non-academic data, including things like absentee and suspension rates and other measures of student health and well-being.
“That’s a huge part of pandemic recovery,” he said.
In the meantime, Maher said the current data can be meaningful when it comes to individual students.
If, for example, a student who ordinarily scores a five instead scored a three or a student who normally scores a three got a one during the pandemic year, “that might be something that warrants investigation,” he said.
Behind the Story
Noah de Comarmond created the spreadsheet. Alex Granados did the reporting.
Recommended reading


